
Compare Rungta Irrigatn. with Similar Stocks
Dashboard
Poor Management Efficiency with a low ROCE of 4.77%
- The company has been able to generate a Return on Capital Employed (avg) of 4.77% signifying low profitability per unit of total capital (equity and debt)
Low ability to service debt as the company has a high Debt to EBITDA ratio of 2.77 times
The company has declared Negative results for the last 3 consecutive quarters
Consistent Underperformance against the benchmark over the last 3 years
Stock DNA
Plastic Products - Industrial
INR 106 Cr (Micro Cap)
19.00
36
0.00%
0.27
5.53%
0.98
Total Returns (Price + Dividend) 
Rungta Irrigatn. for the last several years.
Risk Adjusted Returns v/s
Returns Beta

News
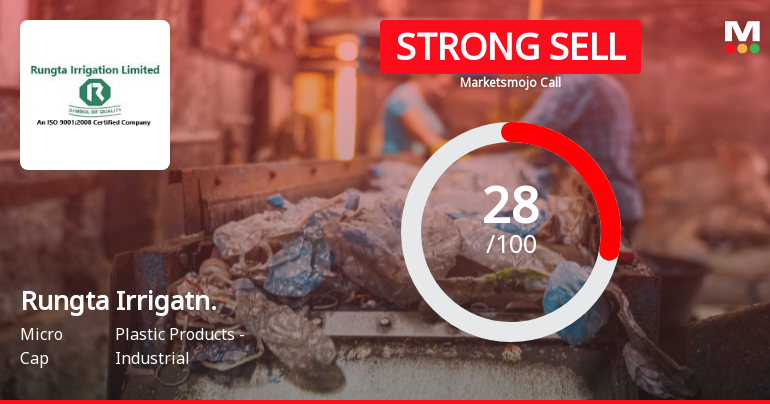
Rungta Irrigation Ltd Downgraded to Strong Sell Amid Weak Financials and Bearish Technicals
Rungta Irrigation Ltd, a micro-cap player in the Plastic Products - Industrial sector, has been downgraded from Sell to Strong Sell following a comprehensive reassessment of its quality, valuation, financial trend, and technical parameters. The downgrade reflects deteriorating fundamentals, persistent negative financial performance, and increasingly bearish technical signals, signalling caution for investors amid ongoing underperformance against benchmarks.
Read full news articleAre Rungta Irrigation Ltd latest results good or bad?
Rungta Irrigation Ltd's latest financial results for the quarter ended March 2026 reveal a complex operational landscape. The company reported a net profit of ₹2.34 crores, reflecting a significant quarter-on-quarter growth of 73.33%. However, this profit improvement is largely attributed to a substantial increase in non-operating income, which constituted 84.47% of profit before tax, raising concerns about the sustainability of these earnings. Net sales for the same quarter amounted to ₹52.67 crores, indicating a sequential growth of 10.37% compared to the previous quarter. Despite this positive sequential change, the year-on-year performance shows a decline of 18.33%, highlighting ongoing challenges in demand and market share. The company has faced a consistent downward trend in revenue throughout FY26, with a half-yearly revenue contraction of 25.36% compared to the same period last year. The operating...
Read full news article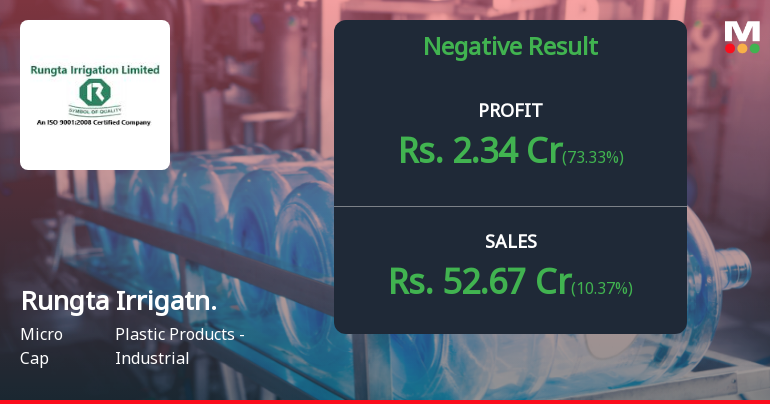
Rungta Irrigation Q4 FY26: Profit Surge Masks Deepening Revenue Concerns
Rungta Irrigation Ltd., a micro-cap player in the industrial plastic products sector, reported a net profit of ₹2.34 crores for the quarter ended March 2026 (Q4 FY26), marking a striking 73.33% sequential improvement from ₹1.35 crores in Q3 FY26. However, this profit bounce masks a more troubling narrative: revenues declined 18.33% year-on-year to ₹52.67 crores, continuing a pattern of sustained topline weakness that has persisted throughout FY26. The company's stock, currently trading at ₹52.60 with a market capitalisation of ₹105.00 crores, has declined 22.52% over the past year, significantly underperforming both the Sensex and its sector peers.
Read full news article Announcements
Board Meeting Intimation for Considering And Approving The Proposal Of Fund Raising By Way Of Offer And Issuance Of Fully Paid Up Equity Shares Of The Company By Way Of A Rights Issue To The Eligible Equity Shareholders Of The Company.
09-Jun-2026 | Source : BSERungta Irrigation Ltdhas informed BSE that the meeting of the Board of Directors of the Company is scheduled on 12/06/2026 inter alia to consider and approve the proposal of fund raising by way of offer and issuance of fully paid up equity shares of the Company by way of a rights issue to the eligible equity shareholders of the Company.
Closure of Trading Window
09-Jun-2026 | Source : BSETrading window for trading in securities of the company by the designated person shall remain closed till conclusion of 48 hours from conclusion of Board Meeting.
Compliances-Reg. 39 (3) - Details of Loss of Certificate / Duplicate Certificate
05-Jun-2026 | Source : BSEThe Company has received intimation from RTA- Beetal Financial & Computer Services Pvt. Ltd. regarding the request for issue of duplicate share certificates of the Company that will be issued shortly.
Corporate Actions

12 Jun 2026

No Dividend history available

No Splits history available

No Bonus history available

Rungta Irrigation Ltd has announced 1:1 rights issue, ex-date: 11 Nov 22
Quality key factors
Valuation key factors
Technicals key factors
 Technical Indicator Scale: Bearish, Mildly Bearish, Sideways, Mildly Bullish, Bullish Turned
 Shareholding Snapshot : Mar 2026
Shareholding Compare (%holding)
Non Institution
None
Held by 0 Schemes
Held by 0 FIIs
Mahabir Prasad Rungta (17.21%)
Samara Realty Private Limited (20.49%)
6.35%
Quarterly Results Snapshot (Standalone) - Mar'26 - QoQ

QoQ Growth in quarter ended Mar 2026 is 10.37% vs 7.62% in Dec 2025

QoQ Growth in quarter ended Mar 2026 is 73.33% vs 193.48% in Dec 2025
Half Yearly Results Snapshot (Standalone) - Sep'25
Not Applicable: The company has declared_date for only one period
Not Applicable: The company has declared_date for only one period
Nine Monthly Results Snapshot (Standalone) - Dec'25
YoY Growth in nine months ended Dec 2025 is -17.02% vs 58.77% in Dec 2024
YoY Growth in nine months ended Dec 2025 is -43.85% vs 24.39% in Dec 2024
Annual Results Snapshot (Standalone) - Mar'26
YoY Growth in year ended Mar 2026 is -17.40% vs 47.44% in Mar 2025
YoY Growth in year ended Mar 2026 is -11.74% vs 10.09% in Mar 2025
About Rungta Irrigation Ltd

Company Coordinates


