
Compare S Chand & Compan with Similar Stocks
Dashboard
Despite the size of the company, domestic mutual funds hold only 0.55% of the company
- Domestic mutual funds have capability to do in-depth on-the-ground research on companies- their small stake may signify either they are not comfortable at the price or the business
Consistent Underperformance against the benchmark over the last 3 years
Total Returns (Price + Dividend) 
Latest dividend: 4 per share ex-dividend date: May-29-2026
Risk Adjusted Returns v/s
Returns Beta

News
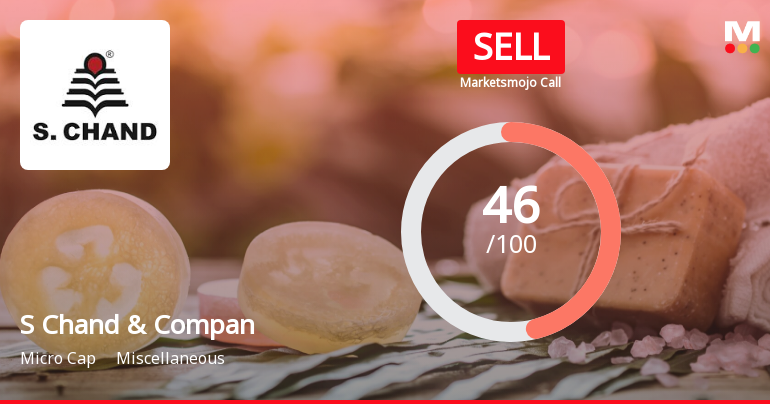
S Chand & Company Ltd Downgraded to Sell Amid Technical Weakness and Underperformance
S Chand & Company Ltd, a micro-cap player in the miscellaneous sector, has seen its investment rating downgraded from Hold to Sell as of 10 June 2026. This shift reflects a combination of deteriorating technical indicators, persistent underperformance against benchmarks, and mixed financial trends despite some positive quarterly results.
Read full news article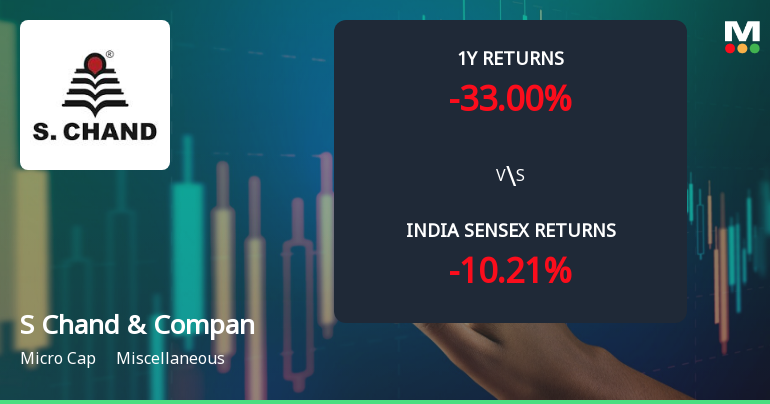
S Chand & Company Ltd Faces Bearish Momentum Amid Technical Downgrade
S Chand & Company Ltd has experienced a notable shift in its technical momentum, with key indicators signalling a transition from mildly bearish to bearish trends. Despite a marginal day change of -0.10%, the stock’s technical parameters, including MACD, RSI, Bollinger Bands, and moving averages, reveal a complex picture that investors should carefully analyse amid broader market pressures.
Read full news article
S Chand & Company Ltd is Rated Hold
S Chand & Company Ltd is rated 'Hold' by MarketsMOJO, with this rating last updated on 25 May 2026. However, the analysis and financial metrics presented here reflect the stock's current position as of 09 June 2026, providing investors with an up-to-date view of the company’s fundamentals, returns, and market standing.
Read full news article Announcements
Compliances-Reg.24(A)-Annual Secretarial Compliance
28-May-2026 | Source : BSECompliance - Regulation 24A - Annual Secretarial Compliance Report of S Chand And Company Limited for the financial year ended March 31 2026
Announcement under Regulation 30 (LODR)-Earnings Call Transcript
28-May-2026 | Source : BSEEarning call Transcript - Q4FY26
Announcement under Regulation 30 (LODR)-Analyst / Investor Meet - Outcome
25-May-2026 | Source : BSEAudio recording of Investors / Analysts conference call - Q4FY26 - held on May 25 2026
Corporate Actions

No Upcoming Board Meetings

S Chand & Company Ltd has declared 80% dividend, ex-date: 29 May 26

No Splits history available

No Bonus history available

No Rights history available
Quality key factors
Valuation key factors
Technicals key factors
 Technical Indicator Scale: Bearish, Mildly Bearish, Sideways, Mildly Bullish, Bullish Turned
 Shareholding Snapshot : Mar 2026
Shareholding Compare (%holding)
Promoters
None
Held by 1 Schemes (0.29%)
Held by 12 FIIs (4.47%)
Neerja Jhunjhnuwala (22.68%)
Srinivasan Varadarajan (4.75%)
38.11%
Quarterly Results Snapshot (Consolidated) - Mar'26 - YoY

YoY Growth in quarter ended Mar 2026 is 16.21% vs 7.83% in Mar 2025
YoY Growth in quarter ended Mar 2026 is 19.65% vs 9.81% in Mar 2025
Half Yearly Results Snapshot (Consolidated) - Sep'25
Growth in half year ended Sep 2025 is 2.61% vs -0.67% in Sep 2024
Growth in half year ended Sep 2025 is -22.83% vs -42.51% in Sep 2024
Nine Monthly Results Snapshot (Consolidated) - Dec'25

YoY Growth in nine months ended Dec 2025 is 1.07% vs 10.13% in Dec 2024
YoY Growth in nine months ended Dec 2025 is -19.75% vs -7.95% in Dec 2024
Annual Results Snapshot (Consolidated) - Mar'26
YoY Growth in year ended Mar 2026 is 10.99% vs 8.61% in Mar 2025
YoY Growth in year ended Mar 2026 is 19.52% vs 12.20% in Mar 2025
About S Chand & Company Ltd

Company Coordinates


