
Compare S I Cap. & Fin. with Similar Stocks
Stock DNA
Diversified Commercial Services
INR 13 Cr (Micro Cap)
39.00
21
0.00%
1.40
5.67%
2.12
Total Returns (Price + Dividend) 
S I Cap. & Fin. for the last several years.
Risk Adjusted Returns v/s
Returns Beta

News
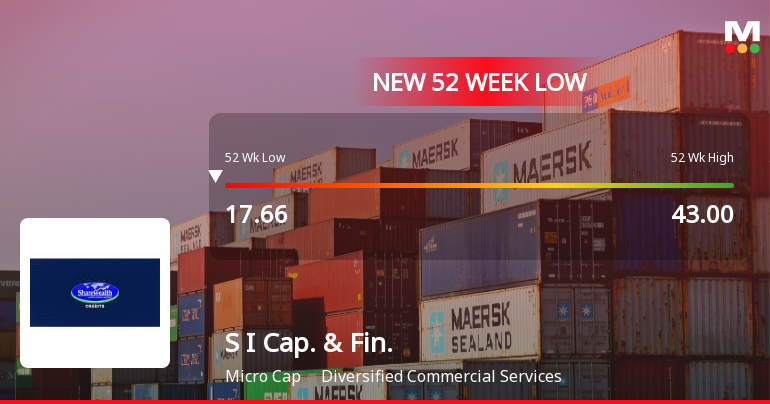
S I Capital & Financial Services Ltd Falls to 52-Week Low Amidst Prolonged Downtrend
A sustained decline has pushed S I Capital & Financial Services Ltd to a fresh 52-week low, marking a 58.07% drop over the past year, significantly underperforming the Sensex's modest 6.23% decline during the same period.
Read full news article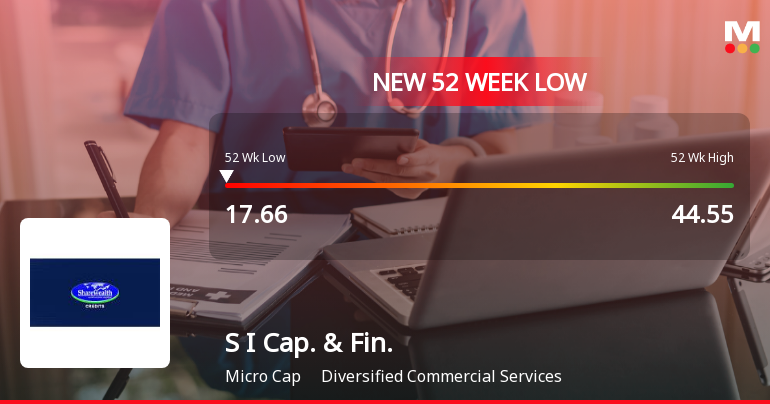
S I Capital & Financial Services Ltd Falls to 52-Week Low of Rs 17.66 as Sell-Off Deepens
For the fourth consecutive session, S I Capital & Financial Services Ltd has declined, culminating in a fresh 52-week low of Rs 17.66 on 2 Jul 2026, marking a 14.6% drop over this losing streak amid a broader market rally.
Read full news article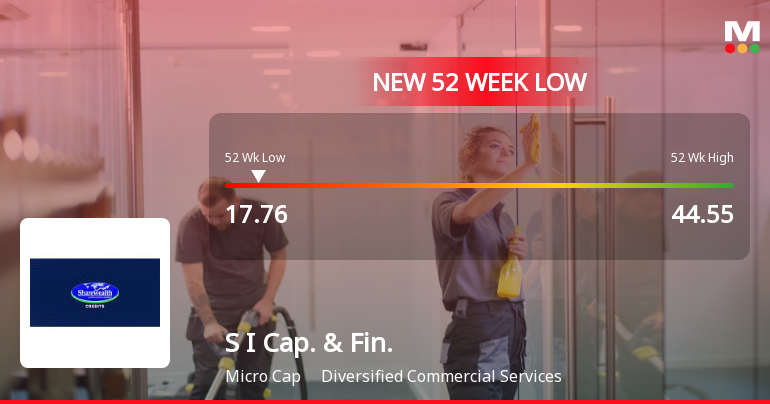
S I Capital & Financial Services Ltd Falls to 52-Week Low of Rs 17.76 Amid Prolonged Downtrend
For the fifth consecutive session, S I Capital & Financial Services Ltd slipped further, hitting a fresh 52-week low of Rs 17.76 on 1 Jul 2026, marking a steep 55.7% decline over the past year despite a modest recovery in profits.
Read full news article Announcements
Price Movement Clarification
16-Jul-2026 | Source : BSEDear Sir/Madam With reference to your letter No. L/SURV/ONL/PV/SJ/2026-2027/4066 we wish to inform you that there is no material information/announcement that has not been disclosed to stock exchange. The movement in the price of the companys shares is purely market-driven. Please take the enclosed clarification letter on record.
Clarification sought from SI Capital & Financial Services Ltd
15-Jul-2026 | Source : BSEThe Exchange has sought clarification from SI Capital & Financial Services Ltd on July 15 2026 with reference to significant movement in price in order to ensure that investors have latest relevant information about the company and to inform the market so that the interest of the investors is safeguarded.
The reply is awaited.
Compliances-Certificate under Reg. 74 (5) of SEBI (DP) Regulations 2018
03-Jul-2026 | Source : BSEIntimation for the submission of the Compliance Certificate under Reg.74(5) of the SEBI (DP) Regulations 2018 for the quarter ended June 30 2026.
Corporate Actions

No Upcoming Board Meetings

No Dividend history available

No Splits history available

No Bonus history available

No Rights history available
Quality key factors
Valuation key factors
Technicals key factors
 Technical Indicator Scale: Bearish, Mildly Bearish, Sideways, Mildly Bullish, Bullish Turned
 Shareholding Snapshot : Jun 2026
Shareholding Compare (%holding)
Non Institution
None
Held by 0 Schemes
Held by 0 FIIs
Sharewealth Securities Limited (39.47%)
Jyothish A R (12.87%)
41.16%
Quarterly Results Snapshot (Standalone) - Mar'26 - QoQ

QoQ Growth in quarter ended Mar 2026 is 9.68% vs 2.20% in Dec 2025
QoQ Growth in quarter ended Mar 2026 is 218.18% vs -200.00% in Dec 2025
Half Yearly Results Snapshot (Standalone) - Sep'25

Growth in half year ended Sep 2025 is 54.39% vs 56.16% in Sep 2024
Growth in half year ended Sep 2025 is 224.00% vs 16.67% in Sep 2024
Nine Monthly Results Snapshot (Standalone) - Dec'25
YoY Growth in nine months ended Dec 2025 is 51.12% vs 47.11% in Dec 2024
YoY Growth in nine months ended Dec 2025 is 322.22% vs 81.63% in Dec 2024
Annual Results Snapshot (Standalone) - Mar'26
YoY Growth in year ended Mar 2026 is 44.92% vs 47.98% in Mar 2025
YoY Growth in year ended Mar 2026 is 94.12% vs 123.61% in Mar 2025
About S I Capital & Financial Services Ltd

Company Coordinates


