
Compare S. V. J. Enterp. with Similar Stocks
Dashboard
Weak Long Term Fundamental Strength as the company has not declared results in the last 6 months
- Company's ability to service its debt is weak with a poor EBIT to Interest (avg) ratio of 0.93
- The company has been able to generate a Return on Equity (avg) of 5.11% signifying low profitability per unit of shareholders funds
Flat results in Mar 24
With ROE of 4.4, it has a Very Expensive valuation with a 5.8 Price to Book Value
Underperformed the market in the last 1 year
Stock DNA
Paper, Forest & Jute Products
INR 101 Cr (Micro Cap)
131.00
46
0.00%
-0.19
4.42%
6.07
Total Returns (Price + Dividend) 
S. V. J. Enterp. for the last several years.
Risk Adjusted Returns v/s
Returns Beta

News
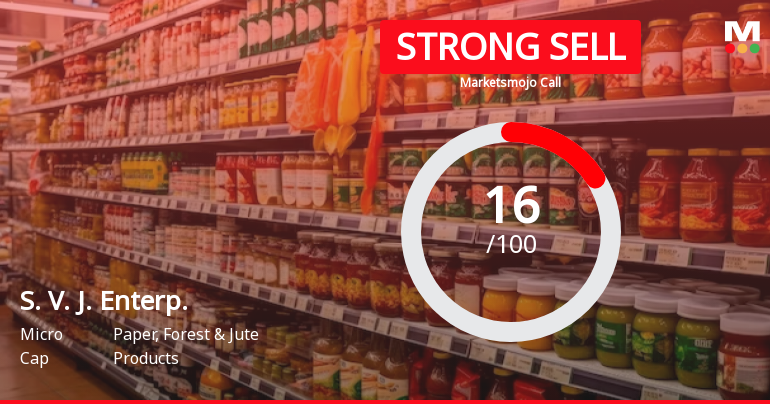
S. V. J. Enterprises Ltd is Rated Strong Sell
S. V. J. Enterprises Ltd is rated Strong Sell by MarketsMOJO, with this rating last updated on 15 May 2026. However, the analysis and financial metrics presented here reflect the company’s current position as of 17 July 2026, providing investors with the latest insights into its performance and outlook.
Read full news article
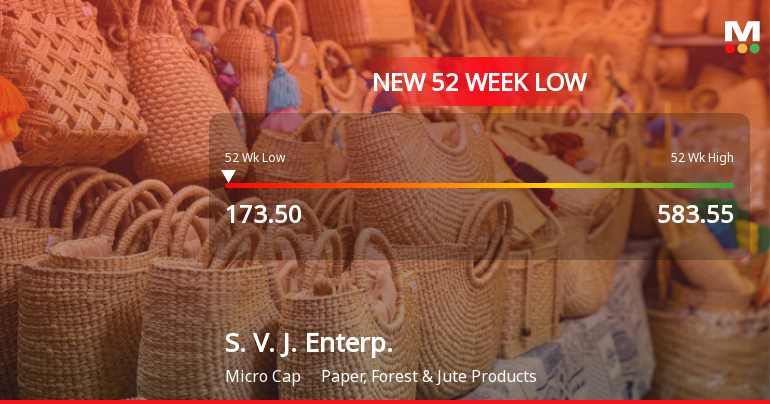
S. V. J. Enterprises Ltd Falls to 52-Week Low of Rs 182.6 as Sell-Off Deepens
For the sixth consecutive session, S. V. J. Enterprises Ltd has closed lower, culminating in a fresh 52-week low of Rs 182.6 on 16 Jul 2026. This represents a sharp 22.63% decline over this losing streak, significantly underperforming its sector and the broader market indices.
Read full news article Announcements
Compliances-Certificate under Reg. 74 (5) of SEBI (DP) Regulations 2018
14-Jul-2026 | Source : BSEDisclosure under Reg. 74(5) of SEBI (DP) Regulation 2018
Audited Financial Results Of The Company For Half Year And Year Ended 31St March 2026
30-May-2026 | Source : BSEAudited Financial Results for the half year and year ended March 31 2026
Appointment Of S K Dwivedi & Associates As The Secretarial Auditors Of The Company To Conduct The Secretarial Audit For A Period Of 5 Years Commencing Form The Financial Year 2025-26 Upto Financial Year 2029-30.
30-May-2026 | Source : BSEAppointment of Secretarial Auditor
Corporate Actions

No Upcoming Board Meetings

No Dividend history available

No Splits history available

No Bonus history available

No Rights history available
Quality key factors
Valuation key factors
Technicals key factors
 Technical Indicator Scale: Bearish, Mildly Bearish, Sideways, Mildly Bullish, Bullish Turned
 Shareholding Snapshot : Jun 2026
Shareholding Compare (%holding)
Promoters
None
Held by 0 Schemes
Held by 0 FIIs
Suresh Ramchandra Jha (31.91%)
Jr Seamless Private Limited (7.46%)
18.62%
Quarterly Results Snapshot (Standalone) - Mar'24 - QoQ

QoQ Growth in quarter ended Mar 2024 is 3.20% vs -8.76% in Dec 2023

QoQ Growth in quarter ended Mar 2024 is -69.57% vs 4.55% in Dec 2023
Half Yearly Results Snapshot (Standalone) - Mar'26
Growth in half year ended Mar 2026 is 583.05% vs -73.54% in Sep 2025
Growth in half year ended Mar 2026 is 463.64% vs -38.89% in Sep 2025
Nine Monthly Results Snapshot (Standalone) - Mar'24
YoY Growth in nine months ended Mar 2024 is -55.56% vs -6.21% in Mar 2024
YoY Growth in nine months ended Mar 2024 is -58.14% vs -34.85% in Mar 2024
Annual Results Snapshot (Standalone) - Mar'26
YoY Growth in year ended Mar 2026 is -10.83% vs -10.86% in Mar 2025
YoY Growth in year ended Mar 2026 is 37.74% vs -28.38% in Mar 2025
About S. V. J. Enterprises Ltd

Company Coordinates


