
Compare Saatvik Green with Similar Stocks
Dashboard
High Management Efficiency with a high ROCE of 0%
Healthy long term growth as Net Sales has grown by an annual rate of 0% and Operating profit at 0%
Flat results in Mar 26
With ROCE of 21.6, it has a Attractive valuation with a 3.1 Enterprise value to Capital Employed
Increasing Participation by Institutional Investors
Stock DNA
Other Electrical Equipment
INR 5,850 Cr (Small Cap)
16.00
61
0.00%
0.63
26.66%
4.36
Total Returns (Price + Dividend) 
Saatvik Green for the last several years.
Risk Adjusted Returns v/s
Returns Beta

News
Saatvik Green Energy Ltd is Rated Hold by MarketsMOJO
Saatvik Green Energy Ltd is rated 'Hold' by MarketsMOJO, with this rating last updated on 22 May 2026. However, the analysis and financial metrics discussed here reflect the stock's current position as of 11 July 2026, providing investors with an up-to-date view of the company’s fundamentals, valuation, financial trends, and technical outlook.
Read full news article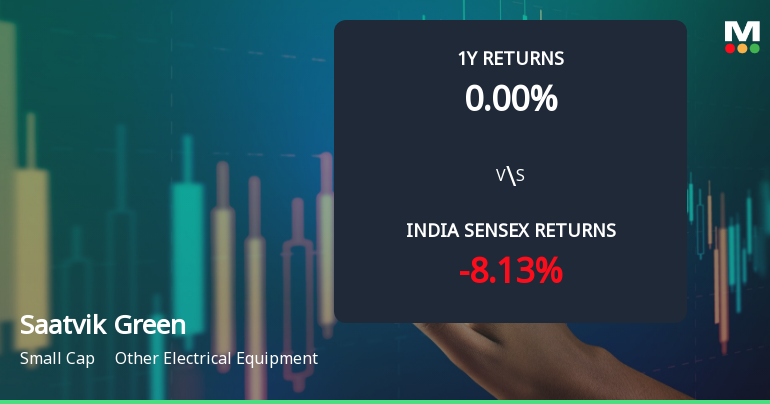
Saatvik Green Energy Ltd Shows Renewed Momentum Amid Technical Shift
Saatvik Green Energy Ltd, a small-cap player in the Other Electrical Equipment sector, has experienced a notable shift in its technical momentum, moving from a mildly bearish to a mildly bullish trend. This change is underscored by a strong day gain of 8.47% and a current price of ₹454.15, signalling renewed investor interest despite mixed signals from various technical indicators.
Read full news article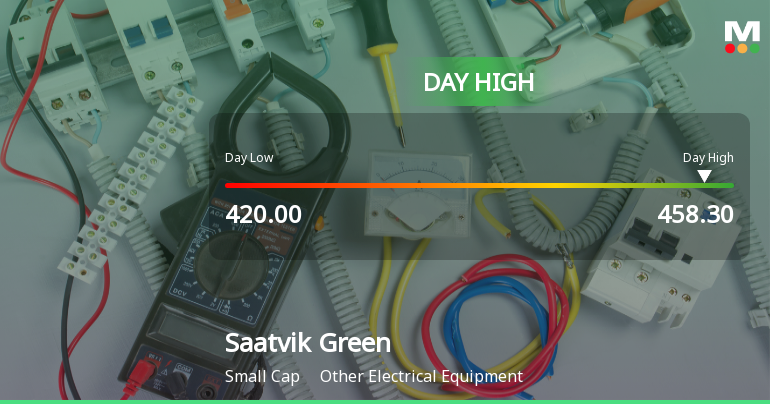
Saatvik Green Energy Ltd Surges 8.91% to Day's High of Rs 448.05 — Outperforms Sector by 5.13 Percentage Points
The Sensex advanced 0.84% on 09 Jul 2026, yet Saatvik Green Energy Ltd outpaced the broader market with an 8.91% gain, reaching an intraday high of Rs 448.05. This 5.13 percentage-point outperformance over its sector signals a distinctly stock-specific rally rather than a market-wide lift.
Read full news article Announcements
Compliances-Certificate under Reg. 74 (5) of SEBI (DP) Regulations 2018
14-Jul-2026 | Source : BSECertificate under 74 (5) of SEBI (DP) Regulations 2018
Closure of Trading Window
26-Jun-2026 | Source : BSEClosure of Trading Window
Compliances-Reg.24(A)-Annual Secretarial Compliance
28-May-2026 | Source : BSEAnnual Secretarial Compliance Report for the Financial Year ended March 31 2026.
Corporate Actions

No Upcoming Board Meetings

No Dividend history available

No Splits history available

No Bonus history available

No Rights history available
Quality key factors
Valuation key factors
Technicals key factors
 Technical Indicator Scale: Bearish, Mildly Bearish, Sideways, Mildly Bullish, Bullish Turned
 Shareholding Snapshot : Mar 2026
Shareholding Compare (%holding)
Promoters
None
Held by 7 Schemes (10.1%)
Held by 4 FIIs (0.03%)
Spg Trust (38.29%)
Prashant Mathur (8.78%)
4.18%
Quarterly Results Snapshot (Standalone) - Mar'26 - QoQ

QoQ Growth in quarter ended Mar 2026 is -14.63% vs 29.15% in Dec 2025
QoQ Growth in quarter ended Mar 2026 is -70.43% vs 1,026.74% in Dec 2025
Half Yearly Results Snapshot (Standalone) - Sep'25
Not Applicable: The company has declared_date for only one period
Not Applicable: The company has declared_date for only one period
Nine Monthly Results Snapshot (Standalone) - Dec'25
Not Applicable: The company has declared_date for only one period
Not Applicable: The company has declared_date for only one period
Annual Results Snapshot (Consolidated) - Mar'26

YoY Growth in year ended Mar 2026 is 110.73% vs 98.39% in Mar 2025
YoY Growth in year ended Mar 2026 is 64.40% vs 116.42% in Mar 2025
About Saatvik Green Energy Ltd

Company Coordinates


