
Compare SAB Events with Similar Stocks
Dashboard
With a Negative Book Value, the company has a Weak Long Term Fundamental Strength
- Poor long term growth as Net Sales has grown by an annual rate of 11.50% over the last 5 years
- Low ability to service debt as the company has a high Debt to EBITDA ratio of -2.01 times
Flat results in Mar 26
Risky - Negative Operating Profits
55.14% of Promoter Shares are Pledged
Stock DNA
Media & Entertainment
INR 10 Cr (Micro Cap)
NA (Loss Making)
33
0.00%
-0.83
17.65%
-4.25
Total Returns (Price + Dividend) 
SAB Events for the last several years.
Risk Adjusted Returns v/s
Returns Beta

News

SAB Events & Governance Now Media Ltd Locks at Lower Circuit With 5.0% Loss — Sellers Queue, No Buyers in Sight
At Rs 8.74, SAB Events & Governance Now Media Ltd locked at its lower circuit limit of 5.0% on 13 Jul 2026, with persistent unfilled supply as sellers outnumbered buyers and the price froze at the floor level.
Read full news article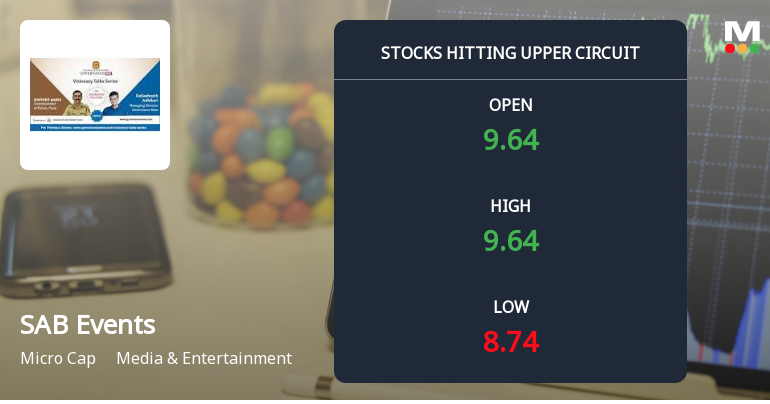
A 4.9% Single-Day Surge Takes SAB Events & Governance Now Media Ltd to Its Upper Circuit Limit of Rs 9.2
At Rs 9.2, the buying was done — not because demand dried up, but because the exchange would not permit the stock to rise further. SAB Events & Governance Now Media Ltd locked at its upper circuit of 4.9% on 10 Jul 2026, with buyers queuing and no sellers willing to part with shares.
Read full news article
SAB Events & Governance Now Media Ltd Locks at Upper Circuit With 4.93% Gain — Buyers Queue, Sellers Absent
At Rs 9.15, the buying was done — not because demand dried up, but because the exchange wouldn't let the stock go any higher. SAB Events & Governance Now Media Ltd locked at its upper circuit of 4.93% on 7 Jul 2026, with buyers queuing and no sellers willing to part with shares.
Read full news article Announcements
Corporate Insolvency Resolution Process (CIRP)-Approval of Resolution plan by Tribunal
11-Jul-2026 | Source : BSEIntimation for receipt of order passed by Honble NCLT Mumbai Bench on July 10 2026 in respect of Pre-Packaged Insolvency Resolution Process (PPIRP)
Corporate Insolvency Resolution Process (CIRP)-Approval of Resolution plan by Tribunal
10-Jul-2026 | Source : BSEIntimation for Orally Pronounced Order by the Honble NCLT Mumbai Bench today i.e. July 10 2026 in respect of the Pre-Packaged Insolvency Resolution process (PPIRP).
Compliances-Certificate under Reg. 74 (5) of SEBI (DP) Regulations 2018
07-Jul-2026 | Source : BSECompliance Certificate under Reg. 74 (5) of SEBI (DP) Regulations 2018 for the Quarter ended June 30 2026
Corporate Actions

No Upcoming Board Meetings

No Dividend history available

No Splits history available

No Bonus history available

No Rights history available
Quality key factors
Valuation key factors
Technicals key factors
 Technical Indicator Scale: Bearish, Mildly Bearish, Sideways, Mildly Bullish, Bullish Turned
 Shareholding Snapshot : Mar 2026
Shareholding Compare (%holding)
Non Institution
55.1419
Held by 2 Schemes (0.0%)
Held by 2 FIIs (0.0%)
Late Gautam Navnitlal Adhikari (11.96%)
Kalash Trading And Investments Pvt Ltd (7.21%)
38.93%
Quarterly Results Snapshot (Standalone) - Mar'26 - YoY

YoY Growth in quarter ended Mar 2026 is 3.51% vs -29.63% in Mar 2025
YoY Growth in quarter ended Mar 2026 is 43.33% vs -1,400.00% in Mar 2025
Half Yearly Results Snapshot (Standalone) - Sep'25
Growth in half year ended Sep 2025 is 31.51% vs 17.74% in Sep 2024
Growth in half year ended Sep 2025 is 40.62% vs 0.00% in Sep 2024
Nine Monthly Results Snapshot (Standalone) - Dec'25
YoY Growth in nine months ended Dec 2025 is 57.26% vs 21.87% in Dec 2024

YoY Growth in nine months ended Dec 2025 is 43.18% vs 58.88% in Dec 2024
Annual Results Snapshot (Standalone) - Mar'26
YoY Growth in year ended Mar 2026 is 39.66% vs -1.69% in Mar 2025
YoY Growth in year ended Mar 2026 is 43.24% vs 32.11% in Mar 2025
About SAB Events & Governance Now Media Ltd

Company Coordinates


