
Compare SAB Events with Similar Stocks
Dashboard
With a Negative Book Value, the company has a Weak Long Term Fundamental Strength
- Poor long term growth as Net Sales has grown by an annual rate of 11.50% over the last 5 years
- Low ability to service debt as the company has a high Debt to EBITDA ratio of -2.01 times
Flat results in Mar 26
Risky - Negative Operating Profits
55.14% of Promoter Shares are Pledged
Stock DNA
Media & Entertainment
INR 9 Cr (Micro Cap)
NA (Loss Making)
33
0.00%
-0.83
17.65%
-3.84
Total Returns (Price + Dividend) 
SAB Events for the last several years.
Risk Adjusted Returns v/s
Returns Beta

News

Below All Moving Averages and Now at Lower Circuit: SAB Events & Governance Now Media Ltd Loses 0.12% in a Single Session
At Rs 7.9, sellers were still queuing — but there were no buyers willing to take the other side. SAB Events & Governance Now Media Ltd locked at its lower circuit of 5% on 15 Jul 2026, with unfilled sell orders and a frozen price that capped losses at 0.12% for the day.
Read full news article
SAB Events & Governance Now Media Ltd Locks at Lower Circuit With 4.92% Loss — Sellers Queue, No Buyers in Sight
At Rs 8.31, SAB Events & Governance Now Media Ltd locked at its lower circuit on 14 Jul 2026, reflecting a 4.92% decline within a 5% price band. Despite sellers lining up to exit, there were no buyers willing to absorb the supply, resulting in unfilled sell orders and a frozen price.
Read full news article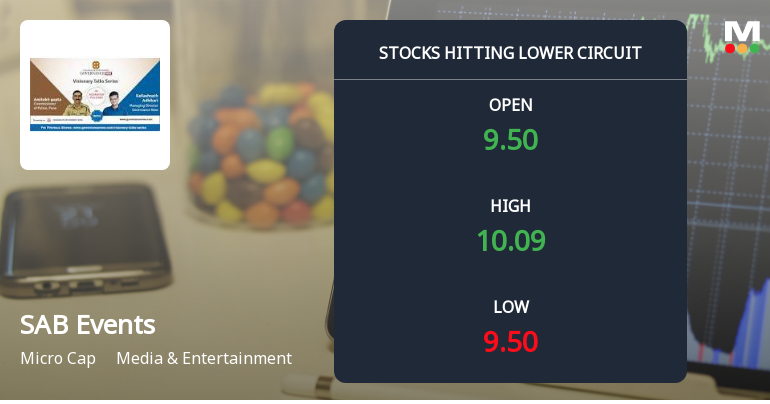
SAB Events & Governance Now Media Ltd Locks at Lower Circuit With 5.0% Loss — Sellers Queue, No Buyers in Sight
At Rs 8.74, SAB Events & Governance Now Media Ltd locked at its lower circuit limit of 5.0% on 13 Jul 2026, with persistent unfilled supply as sellers outnumbered buyers and the price froze at the floor level.
Read full news article Announcements
Sab Events & Governance Now Media Limited - Outcome of Board Meeting
15-Nov-2019 | Source : NSESab Events & Governance Now Media Limited has informed the Exchange regarding Board meeting held on November 14, 2019.
Sab Events & Governance Now Media Limited - Disclosure under SEBI Takeover Regulations
09-Oct-2019 | Source : NSEDisclosure under SEBI Takeover Regulations SABEVENTS : Markand Adhikariáon behalf of Late Mr. Gautam Adhikari has informed the Exchange regarding reason for encumbrance vide letter October 04, 2019 under SEBI ( SAST) Regulations, 2011.
Updates
09-Sep-2019 | Source : NSE
| Sab Events & Governance Now Media Limited has informed the Exchange regarding 'With reference to the above captioned subject and pursuant to Regulation 47 of the SEBI (Listing Obligations and Disclosure Requirements) Regulations, 2015, we wish to inform you that the Company has published the newspaper advertisement of the 6th Annual General Meeting in the following two newspapers:Financial Express (one English Newspaper)Mumbai Mitra (one Marathi Newspaper)The copy of newspaper advertisement is enclosed herewith for your records.Kindly acknowledge the receipt of the same.'. |
Corporate Actions

No Upcoming Board Meetings

No Dividend history available

No Splits history available

No Bonus history available

No Rights history available
Quality key factors
Valuation key factors
Technicals key factors
 Technical Indicator Scale: Bearish, Mildly Bearish, Sideways, Mildly Bullish, Bullish Turned
 Shareholding Snapshot : Mar 2026
Shareholding Compare (%holding)
Non Institution
55.1419
Held by 2 Schemes (0.0%)
Held by 2 FIIs (0.0%)
Late Gautam Navnitlal Adhikari (11.96%)
Kalash Trading And Investments Pvt Ltd (7.21%)
38.93%
Quarterly Results Snapshot (Standalone) - Mar'26 - YoY

YoY Growth in quarter ended Mar 2026 is 3.51% vs -29.63% in Mar 2025
YoY Growth in quarter ended Mar 2026 is 43.33% vs -1,400.00% in Mar 2025
Half Yearly Results Snapshot (Standalone) - Sep'25
Growth in half year ended Sep 2025 is 31.51% vs 17.74% in Sep 2024
Growth in half year ended Sep 2025 is 40.62% vs 0.00% in Sep 2024
Nine Monthly Results Snapshot (Standalone) - Dec'25
YoY Growth in nine months ended Dec 2025 is 57.26% vs 21.87% in Dec 2024

YoY Growth in nine months ended Dec 2025 is 43.18% vs 58.88% in Dec 2024
Annual Results Snapshot (Standalone) - Mar'26
YoY Growth in year ended Mar 2026 is 39.66% vs -1.69% in Mar 2025
YoY Growth in year ended Mar 2026 is 43.24% vs 32.11% in Mar 2025
About SAB Events & Governance Now Media Ltd

Company Coordinates


