
Compare Saboo Sodium with Similar Stocks
Dashboard
With a Operating Losses, the company has a Weak Long Term Fundamental Strength
- Company's ability to service its debt is weak with a poor EBIT to Interest (avg) ratio of 0.90
- The company has been able to generate a Return on Equity (avg) of 0.88% signifying low profitability per unit of shareholders funds
Flat results in Mar 26
Consistent Underperformance against the benchmark over the last 3 years
Total Returns (Price + Dividend) 
Saboo Sodium for the last several years.
Risk Adjusted Returns v/s
Returns Beta

News
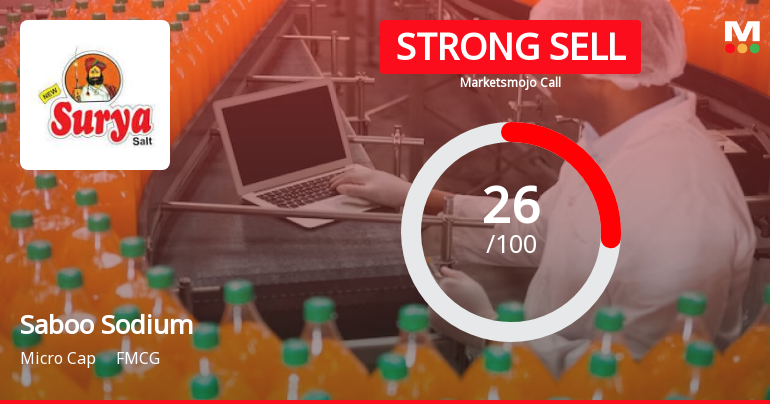
Saboo Sodium Chloro Ltd is Rated Strong Sell
Saboo Sodium Chloro Ltd is rated Strong Sell by MarketsMOJO. This rating was last updated on 01 June 2026, reflecting a reassessment of the stock’s outlook. However, all fundamentals, returns, and financial metrics discussed below are based on the company’s current position as of 04 June 2026, providing investors with the most up-to-date analysis.
Read full news article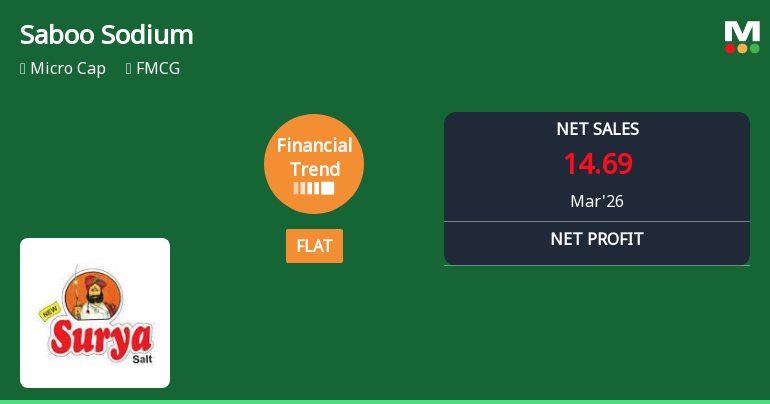
Saboo Sodium Chloro Ltd Reports Flat Quarterly Performance Amid Margin Pressures
Saboo Sodium Chloro Ltd, a micro-cap player in the FMCG sector, has reported a flat financial performance for the quarter ended March 2026, signalling a pause in its recent growth trajectory. Despite some operational strengths, the company continues to grapple with significant margin contraction and profitability challenges, prompting a downgrade to a Strong Sell rating by MarketsMOJO.
Read full news articleAre Saboo Sodium Chloro Ltd latest results good or bad?
The latest financial results for Saboo Sodium Chloro Ltd indicate significant operational challenges. In the quarter ending March 2026, the company reported net sales of ₹14.69 crores, which reflects a sequential decline of 14.54% from ₹17.19 crores in the previous quarter. However, there was a year-on-year growth of 9.87% compared to ₹13.37 crores in the same quarter last year. This suggests that while the company has managed some level of top-line growth on a yearly basis, it faced notable seasonal weakness or demand softness in the most recent quarter. The net profit for Q4 FY26 was a loss of ₹3.51 crores, a stark contrast to a profit of ₹0.85 crores in Q3 FY26, marking a substantial deterioration in profitability. The operating margin also saw a significant contraction, falling to -22.40% from a positive margin of 10.47% in the previous quarter, indicating severe margin pressures that have completely e...
Read full news article Announcements
Board Meeting Outcome for Outcome Of The Board Meeting Held On Saturday 30Th May 2026 At The Registered Office Of The Company Jaipur.
30-May-2026 | Source : BSEOutcome of the meeting of the Board of Directors of the company held at the registered office of the company at L-5 B-II Krishna Marg C-Scheme Jaipur on Saturday May 30 2026 at 03:30 P.M. concluded at 04:10 P.M. interalia to receive consider and take on record the matters as mentioned in the attached PDF.
Audited Financial Results For The Fourth Quarter And Year Ended 31St March 2026.
30-May-2026 | Source : BSEPDF Attached
Compliances-Reg.24(A)-Annual Secretarial Compliance
30-May-2026 | Source : BSEAnnual Secretarial Compliance Report for the Year ended 31st March 2026 attached herewith.
Corporate Actions

No Upcoming Board Meetings

No Dividend history available

No Splits history available

No Bonus history available

Saboo Sodium Chloro Ltd has announced 74:100 rights issue, ex-date: 15 Jun 22
Quality key factors
Valuation key factors
Technicals key factors
 Technical Indicator Scale: Bearish, Mildly Bearish, Sideways, Mildly Bullish, Bullish Turned
 Shareholding Snapshot : Mar 2026
Shareholding Compare (%holding)
Non Institution
None
Held by 5 Schemes (0.08%)
Held by 0 FIIs
Girdhar Saboo (45.72%)
Mahendra Girdharilal (1.59%)
43.31%
Quarterly Results Snapshot (Standalone) - Mar'26 - QoQ

QoQ Growth in quarter ended Mar 2026 is -14.54% vs 11.33% in Dec 2025
QoQ Growth in quarter ended Mar 2026 is -512.94% vs -63.52% in Dec 2025
Half Yearly Results Snapshot (Standalone) - Sep'25
Growth in half year ended Sep 2025 is 17.25% vs 28.45% in Sep 2024
Growth in half year ended Sep 2025 is 20.38% vs 349.15% in Sep 2024
Nine Monthly Results Snapshot (Standalone) - Dec'25
YoY Growth in nine months ended Dec 2025 is 18.30% vs 26.90% in Dec 2024
YoY Growth in nine months ended Dec 2025 is -1.70% vs 56.87% in Dec 2024
Annual Results Snapshot (Standalone) - Mar'26

YoY Growth in year ended Mar 2026 is 16.23% vs 6.24% in Mar 2025
YoY Growth in year ended Mar 2026 is -25.81% vs 34.78% in Mar 2025
About Saboo Sodium Chloro Ltd

Company Coordinates


