
Compare Sadbhav Engg. with Similar Stocks
Dashboard
With a Negative Book Value, the company has a Weak Long Term Fundamental Strength
- Poor long term growth as Net Sales has grown by an annual rate of -15.39% and Operating profit at -34.74% over the last 5 years
- The company has a negative book value of Rs 110.88 crore
- The company has reported losses and also has negative networth. This is not a good sign for the investors. Either company will have to raise fresh capital or report profits to sustain going forward
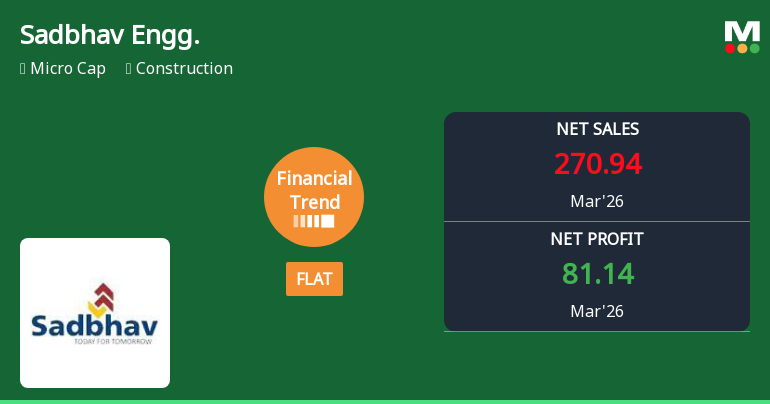
Flat results in Mar 26
Risky - Negative Book Value
Underperformed the market in the last 1 year
Stock DNA
Construction
INR 166 Cr (Micro Cap)
NA (Loss Making)
44
0.00%
-28.32
21.30%
-1.53
Total Returns (Price + Dividend) 
Latest dividend: 1 per share ex-dividend date: Sep-17-2019
Risk Adjusted Returns v/s
Returns Beta

News
Sadbhav Engineering Ltd Reports Flat Quarterly Performance Amid Margin Pressures
Sadbhav Engineering Ltd’s latest quarterly results reveal a flat financial performance for the period ending March 2026, signalling a pause in the company’s previously positive growth trajectory. Despite some operational strengths, key profitability metrics have deteriorated, raising concerns about the firm’s near-term outlook in the competitive construction sector.
Read full news articleAre Sadbhav Engineering Ltd latest results good or bad?
The latest financial results for Sadbhav Engineering Ltd reveal a complex picture of the company's performance. In Q4 FY26, the company reported a consolidated net profit of ₹81.14 crores, a significant turnaround from a loss of ₹72.63 crores in the previous quarter. However, this profit appears to be influenced by accounting adjustments rather than genuine operational improvements, as consolidated profits remain substantially lower than prior periods. On the revenue front, Sadbhav Engineering experienced a year-on-year decline of 6.50%, with net sales at ₹270.94 crores compared to ₹289.78 crores in Q4 FY25. Although there was a sequential increase of 17.84% from the previous quarter, this growth does not offset the broader trend of revenue contraction observed over the past year. Operating margins have also come under pressure, collapsing to 26.33% in Q4 FY26 from 72.16% in the previous quarter, marking ...
Read full news article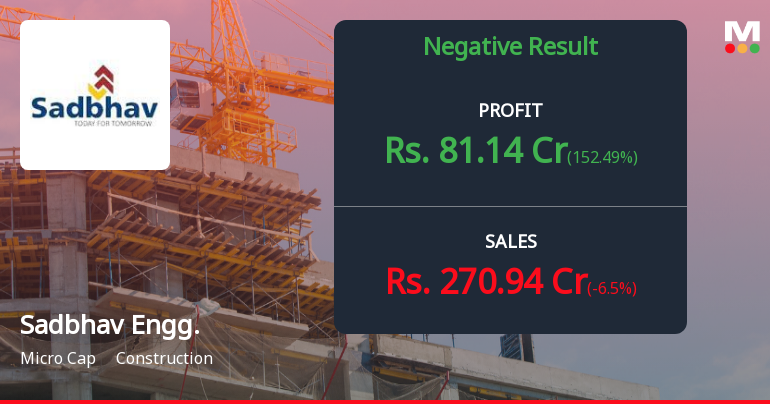
Sadbhav Engineering Q4 FY26: Profitability Swing Masks Deeper Structural Concerns
Sadbhav Engineering Ltd., the Gujarat-based construction company, reported a consolidated net profit of ₹81.14 crores in Q4 FY26, a dramatic reversal from the ₹72.63 crore loss recorded in the previous quarter. However, this apparent turnaround warrants closer scrutiny, as the company continues to grapple with declining revenue, compressed margins, and a deeply negative book value that raises fundamental questions about its long-term viability. With a market capitalisation of just ₹170 crores and the stock trading at ₹9.58, investors have already rendered a harsh verdict on this micro-cap construction firm.
Read full news article Announcements
Announcement under Regulation 30 (LODR)-Newspaper Publication
01-Jun-2026 | Source : BSENewspaper Advertisement pertaining to the Audited Financial Results (Standalone and Consolidated) of the Company for the quarter and year ended on March 31 2026.
Board Meeting Outcome for Please Find Attached Herewith Outcome Of Board Meeting And Audited Financial Results For The Quarter And Year Ended 31St March 2026.
31-May-2026 | Source : BSEPlease find attached herewith outcome of board meeting and audited finacncial results for the quarter and year ended 31st march 2026
Appointment of Company Secretary and Compliance Officer
31-May-2026 | Source : BSEIntimation for Appointment of Mrs. Radhika Bhavin Tanna as Company Secretary and Compliance Officer of the Company w.e.f. May 30 2026.
Corporate Actions

No Upcoming Board Meetings

Sadbhav Engineering Ltd has declared 100% dividend, ex-date: 17 Sep 19

Sadbhav Engineering Ltd has announced 1:10 stock split, ex-date: 07 Dec 10

No Bonus history available

Sadbhav Engineering Ltd has announced 1:20 rights issue, ex-date: 16 Jun 10
Quality key factors
Valuation key factors
Technicals key factors
 Technical Indicator Scale: Bearish, Mildly Bearish, Sideways, Mildly Bullish, Bullish Turned
 Shareholding Snapshot : Mar 2026
Shareholding Compare (%holding)
Non Institution
19.6857
Held by 0 Schemes
Held by 4 FIIs (0.32%)
Shashin Vishnubhai Patel (12.88%)
Catalyst Trusteeship Limited (10.7%)
52.1%
Quarterly Results Snapshot (Consolidated) - Mar'26 - YoY

YoY Growth in quarter ended Mar 2026 is -6.50% vs -38.70% in Mar 2025
YoY Growth in quarter ended Mar 2026 is 152.49% vs 41.19% in Mar 2025
Half Yearly Results Snapshot (Consolidated) - Sep'25
Growth in half year ended Sep 2025 is -6.86% vs -55.93% in Sep 2024
Growth in half year ended Sep 2025 is 316.55% vs 96.27% in Sep 2024
Nine Monthly Results Snapshot (Consolidated) - Dec'25
YoY Growth in nine months ended Dec 2025 is -6.01% vs -48.51% in Dec 2024

YoY Growth in nine months ended Dec 2025 is -57.06% vs 90.50% in Dec 2024
Annual Results Snapshot (Consolidated) - Mar'26
YoY Growth in year ended Mar 2026 is -6.15% vs -46.10% in Mar 2025
YoY Growth in year ended Mar 2026 is 113.89% vs 69.93% in Mar 2025
About Sadbhav Engineering Ltd

Company Coordinates


