
Compare Sadbhav Engg. with Similar Stocks
Dashboard
With a Negative Book Value, the company has a Weak Long Term Fundamental Strength
- Poor long term growth as Net Sales has grown by an annual rate of -15.39% and Operating profit at -34.74% over the last 5 years
- The company has a negative book value of Rs 110.88 crore
- The company has reported losses and also has negative networth. This is not a good sign for the investors. Either company will have to raise fresh capital or report profits to sustain going forward
Flat results in Mar 26
Risky - Negative Book Value
Below par performance in long term as well as near term
Stock DNA
Construction
INR 164 Cr (Micro Cap)
NA (Loss Making)
42
0.00%
-28.32
21.30%
-1.54
Total Returns (Price + Dividend) 
Latest dividend: 1 per share ex-dividend date: Sep-17-2019
Risk Adjusted Returns v/s
Returns Beta

News
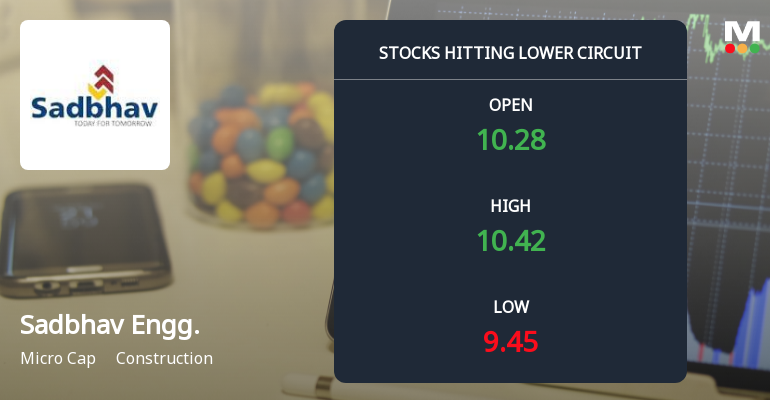
Sadbhav Engineering Ltd Locks at Lower Circuit With 4.98% Loss — Sellers Queue, No Buyers in Sight
At Rs 9.55, sellers were still queuing — but there were no buyers willing to take the other side. Sadbhav Engineering Ltd locked at its lower circuit of 4.98% on 30 Jul 2026, with unfilled sell orders and a frozen price, reflecting persistent selling pressure in a micro-cap stock with limited liquidity.
Read full news article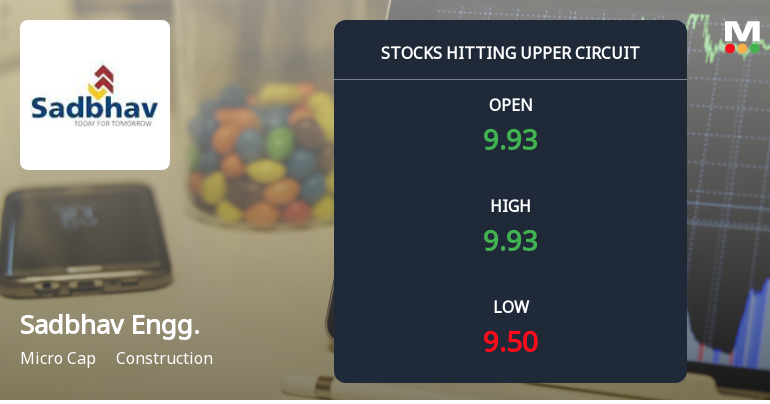
Sadbhav Engineering Ltd Locks at Upper Circuit With 7.55% Gain — Buyers Queue, Sellers Absent
At Rs 10.05, the buying was done — not because demand dried up, but because the exchange wouldn't let the stock go any higher. Sadbhav Engineering Ltd locked at its upper circuit of 7.55% on 29 Jul 2026, with buyers queuing and no sellers willing to part with shares.
Read full news article
Sadbhav Engineering Ltd Locks at Upper Circuit With 9.99% Gain — Buyers Queue, Sellers Absent
At Rs 9.14, the buying was done — not because demand dried up, but because the exchange wouldn't let the stock go any higher. Sadbhav Engineering Ltd locked at its upper circuit of 9.99% on 28 Jul 2026, with buyers queuing and no sellers willing to part with shares.
Read full news article Announcements
Sadbhav Engineering Limited - Updates
09-Dec-2019 | Source : NSESadbhav Engineering Limited has informed the Exchange regarding 'Newspaper Publication of Shares transfer to IEPF'.
Sadbhav Engineering Limited - Disclosure under SEBI Takeover Regulations
05-Dec-2019 | Source : NSESadbhav Engineering Limited has informed the Exchange regarding reason for encumbrance vide letter dated December 04, 2019 under SEBI ( SAST) Regulations, 2011.
Sadbhav Engineering Limited - Disclosure under SEBI Takeover Regulations
27-Nov-2019 | Source : NSEDisclosure under SEBI Takeover Regulations SADBHAV : Sadbhav Finstock Private Ltd has informed the Exchange regarding reason for encumbrance vide letter dated November 26, 2019 under SEBI ( SAST) Regulations, 2011.
Corporate Actions

No Upcoming Board Meetings

Sadbhav Engineering Ltd has declared 100% dividend, ex-date: 17 Sep 19

Sadbhav Engineering Ltd has announced 1:10 stock split, ex-date: 07 Dec 10

No Bonus history available

Sadbhav Engineering Ltd has announced 1:20 rights issue, ex-date: 16 Jun 10
Quality key factors
Valuation key factors
Technicals key factors
 Technical Indicator Scale: Bearish, Mildly Bearish, Sideways, Mildly Bullish, Bullish Turned
 Shareholding Snapshot : Jun 2026
Shareholding Compare (%holding)
Non Institution
19.6857
Held by 0 Schemes
Held by 3 FIIs (0.2%)
Shashin Vishnubhai Patel (12.88%)
Catalyst Trusteeship Limited (10.7%)
52.32%
Quarterly Results Snapshot (Consolidated) - Mar'26 - YoY

YoY Growth in quarter ended Mar 2026 is -6.50% vs -38.70% in Mar 2025
YoY Growth in quarter ended Mar 2026 is 152.49% vs 41.19% in Mar 2025
Half Yearly Results Snapshot (Consolidated) - Sep'25
Growth in half year ended Sep 2025 is -6.86% vs -55.93% in Sep 2024
Growth in half year ended Sep 2025 is 316.55% vs 96.27% in Sep 2024
Nine Monthly Results Snapshot (Consolidated) - Dec'25
YoY Growth in nine months ended Dec 2025 is -6.01% vs -48.51% in Dec 2024

YoY Growth in nine months ended Dec 2025 is -57.06% vs 90.50% in Dec 2024
Annual Results Snapshot (Consolidated) - Mar'26
YoY Growth in year ended Mar 2026 is -6.15% vs -46.10% in Mar 2025
YoY Growth in year ended Mar 2026 is 113.89% vs 69.93% in Mar 2025
About Sadbhav Engineering Ltd

Company Coordinates


