Sadhana Nitro

  • Market Cap: Micro Cap
  • Industry: Commodity Chemicals
  • ISIN: INE888C01040
  • NSEID: SADHNANIQ
  • BSEID: 506642
INR
2.44
0.04 (1.67%)
BSENSE

May 29

BSE+NSE Vol: 1.46 cr

  • Price Points
  • Score
  • Mojo Parameters
  • Total Return
  • News and Corporate Actions
  • Key factors
  • Shareholding
  • Financials
  • CompanyCV
stock-summaryPrice Point
High/Low

1Day

52 Week

Valuation
Technical
Day's Volume

CASH

1.46 cr (1,079.40%) Volume

Shareholding (Mar 2026)

FII

0.00%

Held by 3 FIIs

DII

0.01%

Held by 0 DIIs

Promoter

60.90%

Who are the top shareholders of the Sadhana Nitro?

06-Jun-2025

The top shareholders of Sadhana Nitro include Manekchand Panachand Trading Investment Co Pvt Ltd with 61.1%, individual investors at 30.8%, and public shareholder Kailash Sahebrao Katkar with 1.57%. Foreign institutional investors hold 0.05%, while mutual funds do not hold any shares.

The top shareholders of Sadhana Nitro primarily include the promoters, who hold a significant majority of the shares. The promoter with the highest holding is Manekchand Panachand Trading Investment Co Pvt Ltd, which owns 61.1% of the company. Additionally, individual investors hold about 30.8% of the shares, while the highest public shareholder is Kailash Sahebrao Katkar, with a stake of 1.57%. There are also a few foreign institutional investors (FIIs) involved, holding a combined 0.05%, and mutual funds currently do not hold any shares in the company.

View full answer

What does Sadhana Nitro do?

06-Jun-2025

Sadhana Nitro Chem Ltd manufactures chemical intermediates and performance chemicals, with a market cap of Rs 683 Cr and reported net sales of 49 Cr and net profit of 4 Cr for March 2025. The company has a P/E ratio of 89.00 and a dividend yield of 0.73%.

Overview:<BR>Sadhana Nitro Chem Ltd is engaged in the manufacturing of chemical intermediates, heavy organic chemicals, performance chemicals, and wireless network equipment and services, operating within the micro-cap segment of the commodity chemicals industry.<BR><BR>History:<BR>The company was incorporated on July 21, 1973. As of the latest quarterly results reported for March 2025, Sadhana Nitro Chem Ltd recorded net sales and net profit figures.<BR><BR>Financial Snapshot:<BR>Net Sales: 49 Cr (Quarterly Results - Mar 2025) <BR>Net Profit: 4 Cr (Quarterly Results - Mar 2025) <BR>Market Cap: Rs 683 Cr (Micro Cap)<BR><BR>Key Metrics:<BR>P/E: 89.00 <BR>Industry P/E: 47 <BR>Dividend Yield: 0.73% <BR>Debt-Equity: 0.85 <BR>Return on Equity: 2.69% <BR>Price to Book: 2.41 <BR><BR>Contact Details:<BR>Address: Hira Baug 1st Floor, Kasturba Chowk (C P Tank) Mumbai Maharashtra : 400004 <BR>Tel: 91-22-23865629 <BR>Email: sadhananitro@sncl.com <BR>Website: http://www.sncl.com

View full answer

What is the bonus history of the Sadhana Nitro?

06-Jun-2025

Sadhana Nitro's recent bonus history includes a 2:9 ratio issued on July 5, 2023, a 2:5 ratio on July 19, 2021, and a 1:2 ratio on September 17, 2020, demonstrating the company's commitment to rewarding shareholders.

Sadhana Nitro has a notable bonus history. The most recent bonus issue was a 2:9 ratio, which was announced with an ex-date of July 5, 2023. Prior to that, on July 21, 2021, the company issued a bonus in a 2:5 ratio, with an ex-date of July 19, 2021. Additionally, on September 18, 2020, Sadhana Nitro had a bonus issue at a ratio of 1:2, with the ex-date being September 17, 2020. This reflects the company's commitment to rewarding its shareholders through bonus shares over the years.

View full answer

Has Sadhana Nitro declared dividend?

06-Jun-2025

Yes, Sadhana Nitro Chem Ltd has declared a 15% dividend, amounting to ₹0.15 per share, with an ex-date of September 17, 2024. Despite the dividend declaration, the company has experienced significant price declines over various periods, particularly in the short term.

Sadhana Nitro Chem Ltd has declared a 15% dividend.<BR><BR>Dividend Details:<BR>- Percentage announced: 15%<BR>- Amount per share: 0.15<BR>- Ex-date: 17 Sep 24<BR><BR>Dividend Yield: 0.73%.<BR><BR>Total Returns by Period:<BR>In the last 6 months, the price return was -60.48%, with a dividend return of 0%, resulting in a total return of -60.48%.<BR><BR>Over the past year, the price return was -59.06%, alongside a dividend return of 0.29%, leading to a total return of -58.77%.<BR><BR>In the 2-year period, the price return was -78.22%, with a dividend return of 0.35%, culminating in a total return of -77.87%.<BR><BR>For the 3-year period, the price return was -72.74%, while the dividend return was 0.52%, resulting in a total return of -72.22%.<BR><BR>In the last 4 years, the price return was -6.56%, with a dividend return of 1.58%, leading to a total return of -4.98%.<BR><BR>Finally, over the 5-year period, the price return was 109.7%, with a dividend return of 5.36%, resulting in a total return of 115.06%.<BR><BR>Overall, while Sadhana Nitro has declared a dividend, the total returns over various periods indicate significant declines in price, particularly in the shorter terms, with the most substantial recovery seen over the 5-year period.

View full answer

Who are the peers of the Sadhana Nitro?

03-Jun-2025

Sadhana Nitro's peers include Tata Chemicals, Chemplast Sanmar, GHCL, India Glycols, Fischer Medical, POCL Enterprises, Indo Borax & Ch., Primo Chemicals, Vikram Thermo, and Mangalam Organic. Among these, POCL Enterprises has the highest 1-year return at 236.24%, while Sadhana Nitro has the lowest at -53.28%.

Peers: The peers of Sadhana Nitro are Tata Chemicals, Chemplast Sanmar, GHCL, India Glycols, Fischer Medical, POCL Enterprises, Indo Borax & Ch., Primo Chemicals, Vikram Thermo, and Mangalam Organic.<BR><BR>Quality Snapshot: Excellent management risk is observed at GHCL, while Good management risk is found at Chemplast Sanmar and the rest. Average management risk is present at Tata Chemicals, India Glycols, Sadhana Nitro, POCL Enterprises, Indo Borax & Ch., Primo Chemicals, Vikram Thermo, and Mangalam Organic. Below Average management risk is noted at Fischer Medical. Growth is Excellent at POCL Enterprises, while Good growth is seen at Vikram Thermo. Below Average growth is found at Tata Chemicals, Chemplast Sanmar, GHCL, India Glycols, Sadhana Nitro, Indo Borax & Ch., Primo Chemicals, and Mangalam Organic. Average growth is observed at Fischer Medical. Capital Structure is Excellent at GHCL and Indo Borax & Ch., while Good capital structure is noted at Fischer Medical. Average capital structure is found at Tata Chemicals, Sadhana Nitro, and Primo Chemicals, while Below Average capital structure is present at Chemplast Sanmar, India Glycols, POCL Enterprises, Vikram Thermo, and Mangalam Organic.<BR><BR>Return Snapshot: The peer with the highest 1-year return is POCL Enterprises at 236.24%, while Sadhana Nitro has the lowest at -53.28%. Sadhana Nitro's 1-year return is significantly lower than all its peers. Additionally, the six-month return is negative for Tata Chemicals, Chemplast Sanmar, Sadhana Nitro, Primo Chemicals, Vikram Thermo, and Mangalam Organic.

View full answer

Is Sadhana Nitro technically bullish or bearish?

11-Jun-2025

As of June 10, 2025, Sadhana Nitro's technical stance is bearish with moderate strength, driven by negative signals from moving averages, MACD, and Bollinger Bands, despite a mildly bullish KST on the weekly timeframe.

As of 10 June 2025, the technical trend has changed from mildly bearish to bearish. The current technical stance for Sadhana Nitro is bearish with moderate strength. Key indicators driving this stance include the bearish signals from the daily moving averages and the monthly MACD, which is also bearish. Additionally, both the weekly and monthly Bollinger Bands indicate bearish conditions. The KST shows a mildly bullish signal on the weekly timeframe, but the overall sentiment remains negative due to the prevailing bearish indicators. The stock has also underperformed significantly compared to the Sensex over various time frames, further supporting the bearish outlook.

View full answer

Who are in the management team of Sadhana Nitro?

16-Jul-2025

As of March 2022, the management team of Sadhana Nitro includes Asit D Javeri (Executive Chairman), Seema A Javeri (Director), Priyam S Jhaveri (Independent Director), Abhishek A Javeri (Managing Director), Pradeep N Desai (Independent Director), Nitin R Jani (Company Secretary & Compliance Officer), and Ayesha Sunil Patel (Independent Director). These members are responsible for the company's governance and operations.

As of March 2022, the management team of Sadhana Nitro includes the following members:<BR><BR>1. Asit D Javeri - Executive Chairman<BR>2. Seema A Javeri - Director<BR>3. Priyam S Jhaveri - Independent Director<BR>4. Abhishek A Javeri - Managing Director<BR>5. Pradeep N Desai - Independent Director<BR>6. Nitin R Jani - Company Secretary & Compliance Officer<BR>7. Ayesha Sunil Patel - Independent Director<BR><BR>These individuals play key roles in the governance and operational management of the company.

View full answer

How big is Sadhana Nitro?

24-Jul-2025

As of 24th July, Sadhana Nitro Chem Ltd has a market capitalization of 257.00 Cr, with recent net sales of 165.55 Cr and a net profit of 7.56 Cr. Shareholder's funds are reported at 226.59 Cr and total assets at 531.89 Cr as of March 2024.

As of 24th July, Sadhana Nitro Chem Ltd has a market capitalization of 257.00 Cr, categorizing it as a Micro Cap company.<BR><BR>In the latest four quarters, Sadhana Nitro reported Net Sales of 165.55 Cr and a Net Profit of 7.56 Cr.<BR><BR>The latest annual period for the balance sheet is March 2024, with Shareholder's Funds reported at 226.59 Cr and Total Assets at 531.89 Cr.

View full answer

How has been the historical performance of Sadhana Nitro?

14-Nov-2025

Sadhana Nitro's historical performance shows declining net sales from 267.03 Cr in Mar'19 to 165.55 Cr in Mar'25, but operating profit has improved, reaching 44.19 Cr with a margin of 25.59%. Despite challenges, cash flow from operations turned positive at 54 Cr in Mar'25, indicating signs of recovery.

Answer:<BR>The historical performance of Sadhana Nitro shows a fluctuating trend in its financial metrics over the years. <BR><BR>Breakdown:<BR>Sadhana Nitro's net sales peaked at 267.03 Cr in Mar'19 but have since declined significantly, reaching 165.55 Cr in Mar'25. The total operating income followed a similar trend, decreasing from 267.03 Cr in Mar'19 to 165.55 Cr in Mar'25. The raw material cost has increased from 39.19 Cr in Mar'20 to 85.28 Cr in Mar'25, contributing to the overall expenditure, which was 123.19 Cr in Mar'25, down from 148.98 Cr in Mar'24. Operating profit (PBDIT) has shown some recovery, increasing from 21.22 Cr in Mar'23 to 44.19 Cr in Mar'25, with an operating profit margin of 25.59% in the latest year. Profit before tax also improved to 11.51 Cr in Mar'25, while profit after tax rose to 7.56 Cr, reflecting a PAT margin of 4.57%. The company's total assets grew from 215.66 Cr in Mar'20 to 637.10 Cr in Mar'25, with total liabilities also increasing to 637.10 Cr. Cash flow from operating activities turned positive at 54 Cr in Mar'25, contrasting with negative figures in previous years, although the net cash outflow was -9 Cr. Overall, while Sadhana Nitro has faced challenges in sales and profitability, there are signs of recovery in operating profit and cash flow.

View full answer

Is Sadhana Nitro overvalued or undervalued?

17-Nov-2025

As of November 14, 2025, Sadhana Nitro is considered risky and overvalued, with a negative PE ratio of -10.88 and an 82.82% year-to-date stock decline, significantly underperforming compared to its peers in the commodity chemicals sector.

As of 14 November 2025, the valuation grade for Sadhana Nitro has moved from very attractive to risky, indicating a significant deterioration in its investment appeal. The company is currently assessed as overvalued, with a PE ratio of -10.88, an EV to EBITDA ratio of 49.55, and a Price to Book Value of 0.81. These figures suggest that the company's stock price does not reflect its underlying financial health, particularly given the negative PE ratio.<BR><BR>In comparison to its peers, Sadhana Nitro's valuation metrics are starkly unfavorable. For instance, Solar Industries has a PE ratio of 95.17 and an EV to EBITDA of 58.57, while Godrej Industries shows a PE of 37.36 and an EV to EBITDA of 40.81. The significant disparity in these ratios highlights Sadhana Nitro's challenging position within the commodity chemicals sector. Furthermore, the company's recent stock performance has been dismal, with a year-to-date decline of 82.82%, contrasting sharply with a 8.22% gain in the Sensex, reinforcing the notion that Sadhana Nitro is currently overvalued.

View full answer

When is the next results date for Sadhana Nitro Chem Ltd?

20-May-2026

The next results date for Sadhana Nitro Chem Ltd is 26 May 2026.

The next results date for Sadhana Nitro Chem Ltd is scheduled for 26 May 2026.

View full answer

Should I buy, sell or hold Sadhana Nitro Chem Ltd?

28-May-2026

Are Sadhana Nitro Chem Ltd latest results good or bad?

28-May-2026

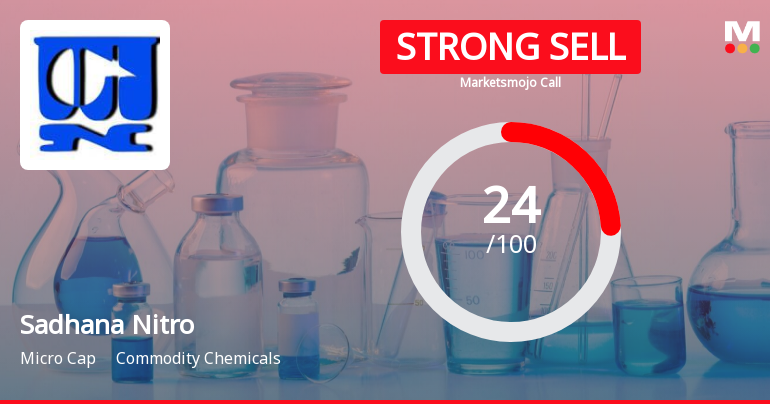
Sadhana Nitro Chem Ltd's latest results are concerning, with a net loss of ₹33.62 crores and an 81.58% drop in revenue, indicating severe operational challenges. The financial performance is classified as a "STRONG SELL," highlighting significant risk for investors.

The latest results for Sadhana Nitro Chem Ltd are quite concerning. In the fourth quarter of FY26, the company reported a net loss of ₹33.62 crores, which is a staggering 920% decline year-on-year. Revenue also plummeted by 81.58% to just ₹9.11 crores compared to the same quarter last year. This significant drop in revenue indicates severe operational challenges and a lack of demand for their products.<BR><BR>The operating margin turned negative at -250.49%, a drastic fall from the positive margin of 26.74% in the previous year. This suggests that the company is not only struggling to generate profits but is also incurring substantial losses relative to its revenue. Additionally, interest costs reached an all-time high of ₹10.72 crores, further exacerbating the financial strain.<BR><BR>Overall, these results reflect a catastrophic collapse in financial performance, raising serious questions about the company's viability and future prospects. The current situation is classified as a "STRONG SELL," indicating significant risk for investors.

View full answer

Why is Sadhana Nitro Chem Ltd falling/rising?

29-May-2026

As of 28-May, Sadhana Nitro Chem Ltd's stock price is 2.41, unchanged from the previous session, with a year-to-date decline of 66.85%. The stock is underperforming compared to the Sensex and shows declining investor participation, indicating ongoing challenges in its performance.

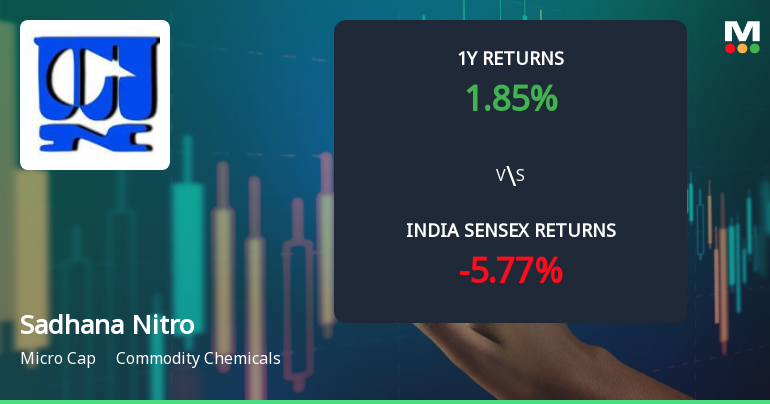
As of 28-May, Sadhana Nitro Chem Ltd's stock price is currently at 2.41, with no change from the previous trading session. The stock has shown a year-to-date decline of 66.85%, significantly underperforming compared to the Sensex, which has decreased by only 10.97% during the same period. Over the past year, the stock has fallen by 87.95%, while the benchmark index has only declined by 6.97%. <BR><BR>In terms of recent performance, the stock has remained relatively stable with a 1-week change of 0.00% and a 1-month increase of 0.84%, which suggests it is not experiencing significant upward momentum. However, it is important to note that the stock's performance today is described as inline with the sector, indicating that it is not outperforming or underperforming relative to its peers.<BR><BR>Additionally, investor participation appears to be declining, as evidenced by a delivery volume of 11.55 lacs on 26 May, which has decreased by 0.33% compared to the 5-day average. This decline in investor participation could contribute to the stock's inability to gain traction despite being higher than the 5-day and 50-day moving averages. However, it remains lower than the 20-day, 100-day, and 200-day moving averages, suggesting that the stock is not in a strong upward trend.<BR><BR>Overall, the combination of significant long-term declines, falling investor participation, and mixed short-term performance indicators suggests that Sadhana Nitro Chem Ltd's stock is currently facing challenges that contribute to its overall downward trajectory.

View full answer
iScoreScore
Click here to find our call on this stock
Strong Sell
Sell
Hold
Buy
Strong Buy

Dashboard

1

With a Operating Losses, the company has a Weak Long Term Fundamental Strength

  • Low ability to service debt as the company has a high Debt to EBITDA ratio of -2.14 times
  • The company has been able to generate a Return on Equity (avg) of 1.96% signifying low profitability per unit of shareholders funds
2

The company has declared negative results for the last 4 consecutive quarters

3

Risky - Negative EBITDA

4

Consistent Underperformance against the benchmark over the last 3 years

stock-summaryMojo Parameters

Mojo Parameters

Loading Valuation Snapshot...

Stock DNA

stock-summary
Industry

Commodity Chemicals

stock-summary
Market cap

INR Cr (Micro Cap)

stock-summary
P/E

NA (Loss Making)

stock-summary
Industry P/E

NA

stock-summary
Dividend Yield

0.00%

stock-summary
Debt Equity

0.00

stock-summary
Return on Equity

0.00%

stock-summary
Price to Book

0.00

Revenue and Profits:
Net Sales:
9 Cr
(Quarterly Results - Mar 2026)
Net Profit:
-34 Cr
stock-summaryTotal Returns
Total Returns (Price + Dividend) stock-summary
Dividend Yield (%)
TimePeriod
Price Return
Dividend Return
Total Return
3 Months
24.49%
0%
24.49%
6 Months
-62.8%
0%
-62.8%
1 Year
-87.67%
0%
-87.67%
2 Years
-95.06%
0.30%
-94.76%
3 Years
-97.0%
0.35%
-96.65%
4 Years
0%
0%
0.0%
5 Years
0%
0%
0.0%

Latest dividend: 0.15 per share ex-dividend date: Sep-17-2024

Risk Adjusted Returns v/s stock-summary
Returns Beta
Icon
Beta has not been calculated since enough price history is not available
stock-summaryNews & Corporate Actions

News

Announcements stock-summary

Icon
No announcement available

Corporate Actions stock-summary

stock-summary
BOARD MEETING

No Upcoming Board Meetings

stock-summary
DIVIDEND

Sadhana Nitro Chem Ltd has declared 10% dividend, ex-date: 22 Sep 25

stock-summary
SPLITS

Sadhana Nitro Chem Ltd has announced 1:5 stock split, ex-date: 03 Apr 20

stock-summary
BONUS

Sadhana Nitro Chem Ltd has announced 2:9 bonus issue, ex-date: 05 Jul 23

stock-summary
RIGHTS

Sadhana Nitro Chem Ltd has announced 8:1 rights issue, ex-date: 18 Feb 26

stock-summaryKey Factors

Quality key factors stock-summary

Factor
Value
Sales Growth (5y)
-13.58%
EBIT Growth (5y)
-232.19%
EBIT to Interest (avg)
0.74
Debt to EBITDA (avg)
7.90
Net Debt to Equity (avg)
0.21
Sales to Capital Employed (avg)
0.36
Tax Ratio
0.97%
Dividend Payout Ratio
43.59%
Pledged Shares
3.69%
Institutional Holding
0.01%
ROCE (avg)
2.64%
ROE (avg)
1.96%

Valuation key factors

Factor
Value
P/E Ratio
NA (Loss Making)
Industry P/E
43
Price to Book Value
1.60
EV to EBIT
-11.84
EV to EBITDA
-15.48
EV to Capital Employed
1.50
EV to Sales
16.54
PEG Ratio
NA
Dividend Yield
NA
ROCE (Latest)
-12.63%
ROE (Latest)
-19.02%

Technicals key factors

Indicator
Weekly
Monthly
MACD
Mildly Bullish
Mildly Bullish
RSI
No Signal
No Signal
Bollinger Bands
Mildly Bearish
Mildly Bearish
Moving Averages
Mildly Bearish (Daily)
KST
Mildly Bullish
Bearish
Dow Theory
Mildly Bearish
Mildly Bullish
OBV
No Trend
No Trend
stock-summary Technical Indicator Scale: Bearish, Mildly Bearish, Sideways, Mildly Bullish, Bullish  Turned 
stock-summaryShareholding
Shareholding Snapshot : Mar 2026stock-summary
Shareholding Compare (%holding) stock-summary
Majority shareholders

Promoters

Pledged Promoter Holdings

3.6896

Mutual Funds

Held by 2 Schemes (0.0%)

FIIs

Held by 3 FIIs (0.0%)

Promoter with highest holding

Asit Dhankumar Javeri (28.99%)

Highest Public shareholder

Niraj Bajaj (4.98%)

Individual Investors Holdings

26.78%

stock-summaryFinancial
[
  {
    "link": "quarterly",
    "btn_text": "All Quarterly Results",
    "header": "Quarterly Results Snapshot (Consolidated) - Mar'26 - QoQ",
    "rhs": [
      {
        "prefix": "Net Sales ",
        "suffix": "QoQ Growth in quarter ended Mar 2026 is -6.66% vs 261.48% in Dec 2025",
        "dir": -1
      },
      {
        "prefix": "Consolidated Net Profit ",
        "suffix": "QoQ Growth in quarter ended Mar 2026 is -33.73% vs 1.60% in Dec 2025",
        "dir": -1
      }
    ],
    "table": {
      "header": [
        "Mar'26",
        "Dec'25",
        "Change(%)"
      ],
      "body": [
        {
          "field": "Net Sales",
          "val1": "9.11",
          "val2": "9.76",
          "chgp": "-6.66%",
          "chgp_class": "negative"
        },
        {
          "field": "Operating Profit (PBDIT) excl Other Income",
          "val1": "-22.82",
          "val2": "-15.19",
          "chgp": "-50.23%",
          "chgp_class": "negative"
        },
        {
          "field": "Interest",
          "val1": "10.72",
          "val2": "6.87",
          "chgp": "56.04%",
          "chgp_class": "negative"
        },
        {
          "field": "Exceptional Items",
          "val1": "0.00",
          "val2": "0.00",
          "chgp": "",
          "chgp_class": "neutral"
        },
        {
          "field": "Consolidate Net Profit",
          "val1": "-33.62",
          "val2": "-25.14",
          "chgp": "-33.73%",
          "chgp_class": "negative"
        },
        {
          "field": "Operating Profit Margin (Excl OI)",
          "val1": "-250.49%",
          "val2": "-155.64%",
          "chgp": "-94.85%",
          "chgp_class": "negative"
        }
      ]
    }
  },
  {
    "link": "half-yearly",
    "btn_text": "All Half Yearly Results",
    "header": "Half Yearly Results Snapshot (Consolidated) - Sep'25",
    "rhs": [
      {
        "prefix": "Net Sales ",
        "suffix": " Growth in half year ended Sep 2025 is -61.00% vs -3.00% in Sep 2024",
        "dir": -1
      },
      {
        "prefix": "Consolidated Net Profit ",
        "suffix": " Growth in half year ended Sep 2025 is -3,243.18% vs -66.54% in Sep 2024",
        "dir": -1
      }
    ],
    "table": {
      "header": [
        "Sep'25",
        "Sep'24",
        "Change(%)"
      ],
      "body": [
        {
          "field": "Net Sales",
          "val1": "30.80",
          "val2": "78.98",
          "chgp": "-61.00%",
          "chgp_class": "negative"
        },
        {
          "field": "Operating Profit (PBDIT) excl Other Income",
          "val1": "-15.04",
          "val2": "17.90",
          "chgp": "-184.02%",
          "chgp_class": "negative"
        },
        {
          "field": "Interest",
          "val1": "8.86",
          "val2": "8.57",
          "chgp": "3.38%",
          "chgp_class": "negative"
        },
        {
          "field": "Exceptional Items",
          "val1": "0.00",
          "val2": "0.00",
          "chgp": "",
          "chgp_class": "neutral"
        },
        {
          "field": "Consolidate Net Profit",
          "val1": "-27.66",
          "val2": "0.88",
          "chgp": "-3,243.18%",
          "chgp_class": "negative"
        },
        {
          "field": "Operating Profit Margin (Excl OI)",
          "val1": "-48.83%",
          "val2": "22.66%",
          "chgp": "-71.49%",
          "chgp_class": "negative"
        }
      ]
    }
  },
  {
    "link": "nine-monthly",
    "btn_text": "All Nine Monthly Results",
    "header": "Nine Monthly Results Snapshot (Consolidated) - Dec'25",
    "rhs": [
      {
        "prefix": "Net Sales ",
        "suffix": "YoY Growth in nine months ended Dec 2025 is -65.06% vs -7.51% in Dec 2024",
        "dir": -1
      },
      {
        "prefix": "Consolidated Net Profit ",
        "suffix": "YoY Growth in nine months ended Dec 2025 is -1,626.01% vs -2.81% in Dec 2024",
        "dir": -1
      }
    ],
    "table": {
      "header": [
        "Dec'25",
        "Dec'24",
        "Change(%)"
      ],
      "body": [
        {
          "field": "Net Sales",
          "val1": "40.56",
          "val2": "116.08",
          "chgp": "-65.06%",
          "chgp_class": "negative"
        },
        {
          "field": "Operating Profit (PBDIT) excl Other Income",
          "val1": "-30.23",
          "val2": "29.13",
          "chgp": "-203.78%",
          "chgp_class": "negative"
        },
        {
          "field": "Interest",
          "val1": "15.73",
          "val2": "13.21",
          "chgp": "19.08%",
          "chgp_class": "negative"
        },
        {
          "field": "Exceptional Items",
          "val1": "0.00",
          "val2": "0.00",
          "chgp": "",
          "chgp_class": "neutral"
        },
        {
          "field": "Consolidate Net Profit",
          "val1": "-52.80",
          "val2": "3.46",
          "chgp": "-1,626.01%",
          "chgp_class": "negative"
        },
        {
          "field": "Operating Profit Margin (Excl OI)",
          "val1": "-74.53%",
          "val2": "25.09%",
          "chgp": "-99.62%",
          "chgp_class": "negative"
        }
      ]
    }
  },
  {
    "link": "annual",
    "btn_text": "All Annual Results",
    "header": "Annual Results Snapshot (Consolidated) - Mar'26",
    "rhs": [
      {
        "prefix": "Net Sales ",
        "suffix": "YoY Growth in year ended Mar 2026 is -70.00% vs -12.89% in Mar 2025",
        "dir": -1
      },
      {
        "prefix": "Consolidated Net Profit ",
        "suffix": "YoY Growth in year ended Mar 2026 is -1,243.12% vs 85.29% in Mar 2025",
        "dir": -1
      }
    ],
    "table": {
      "header": [
        "Mar'26",
        "Mar'25",
        "Change(%)"
      ],
      "body": [
        {
          "field": "Net Sales",
          "val1": "49.67",
          "val2": "165.55",
          "chgp": "-70.00%",
          "chgp_class": "negative"
        },
        {
          "field": "Operating Profit (PBDIT) excl Other Income",
          "val1": "-53.05",
          "val2": "42.36",
          "chgp": "-225.24%",
          "chgp_class": "negative"
        },
        {
          "field": "Interest",
          "val1": "26.45",
          "val2": "17.50",
          "chgp": "51.14%",
          "chgp_class": "negative"
        },
        {
          "field": "Exceptional Items",
          "val1": "0.00",
          "val2": "0.00",
          "chgp": "",
          "chgp_class": "neutral"
        },
        {
          "field": "Consolidate Net Profit",
          "val1": "-86.42",
          "val2": "7.56",
          "chgp": "-1,243.12%",
          "chgp_class": "negative"
        },
        {
          "field": "Operating Profit Margin (Excl OI)",
          "val1": "-106.80%",
          "val2": "25.59%",
          "chgp": "-132.39%",
          "chgp_class": "negative"
        }
      ]
    }
  }
]

Quarterly Results Snapshot (Consolidated) - Mar'26 - QoQstock-summary

Mar'26
Dec'25
Change(%)
Net Sales
9.11
9.76
-6.66%
Operating Profit (PBDIT) excl Other Income
-22.82
-15.19
-50.23%
Interest
10.72
6.87
56.04%
Exceptional Items
0.00
0.00
Consolidate Net Profit
-33.62
-25.14
-33.73%
Operating Profit Margin (Excl OI)
-250.49%
-155.64%
-94.85%
Values in Rs Cr.
Direction Arrows
Net Sales

QoQ Growth in quarter ended Mar 2026 is -6.66% vs 261.48% in Dec 2025

Direction Arrows
Consolidated Net Profit

QoQ Growth in quarter ended Mar 2026 is -33.73% vs 1.60% in Dec 2025

Half Yearly Results Snapshot (Consolidated) - Sep'25stock-summary

Sep'25
Sep'24
Change(%)
Net Sales
30.80
78.98
-61.00%
Operating Profit (PBDIT) excl Other Income
-15.04
17.90
-184.02%
Interest
8.86
8.57
3.38%
Exceptional Items
0.00
0.00
Consolidate Net Profit
-27.66
0.88
-3,243.18%
Operating Profit Margin (Excl OI)
-48.83%
22.66%
-71.49%
Values in Rs Cr.
Direction Arrows
Net Sales

Growth in half year ended Sep 2025 is -61.00% vs -3.00% in Sep 2024

Direction Arrows
Consolidated Net Profit

Growth in half year ended Sep 2025 is -3,243.18% vs -66.54% in Sep 2024

Nine Monthly Results Snapshot (Consolidated) - Dec'25stock-summary

Dec'25
Dec'24
Change(%)
Net Sales
40.56
116.08
-65.06%
Operating Profit (PBDIT) excl Other Income
-30.23
29.13
-203.78%
Interest
15.73
13.21
19.08%
Exceptional Items
0.00
0.00
Consolidate Net Profit
-52.80
3.46
-1,626.01%
Operating Profit Margin (Excl OI)
-74.53%
25.09%
-99.62%
Values in Rs Cr.
Direction Arrows
Net Sales

YoY Growth in nine months ended Dec 2025 is -65.06% vs -7.51% in Dec 2024

Direction Arrows
Consolidated Net Profit

YoY Growth in nine months ended Dec 2025 is -1,626.01% vs -2.81% in Dec 2024

Annual Results Snapshot (Consolidated) - Mar'26stock-summary

Mar'26
Mar'25
Change(%)
Net Sales
49.67
165.55
-70.00%
Operating Profit (PBDIT) excl Other Income
-53.05
42.36
-225.24%
Interest
26.45
17.50
51.14%
Exceptional Items
0.00
0.00
Consolidate Net Profit
-86.42
7.56
-1,243.12%
Operating Profit Margin (Excl OI)
-106.80%
25.59%
-132.39%
Values in Rs Cr.
Direction Arrows
Net Sales

YoY Growth in year ended Mar 2026 is -70.00% vs -12.89% in Mar 2025

Direction Arrows
Consolidated Net Profit

YoY Growth in year ended Mar 2026 is -1,243.12% vs 85.29% in Mar 2025

stock-summaryCompany CV
About Sadhana Nitro Chem Ltd stock-summary
stock-summary
Sadhana Nitro Chem Ltd
Micro Cap
Commodity Chemicals
Sadhana Nitro Chem Limited was incorporated on July 21, 1973. The Company is engaged in manufacturing of chemical intermediates, heavy organic chemicals and performance chemicals and wireless network equipment and services. The company has set up a plant for manufacturing meta amino phenol (MAP) with a capacity of 500 tpa with technical know-how from Biazzi, Switzerland. As on 31st March, 2025 Manekchand Panachand Trading Investment Company Pvt Ltd, holding company owned 61.
Company Coordinates stock-summary
Company Details
Hira Baug 1st Floor, Kasturba Chowk (C P Tank) Mumbai Maharashtra : 400004
stock-summary
Tel: 91-22-23865629
stock-summary
sadhananitro@sncl.com
Registrar Details
Link Intime India Pvt Ltd, C-13 Pannalal Silk Compound, L B S Marg, Bhandup , Mumbai