Sagardeep Alloys

  • Market Cap: Micro Cap
  • Industry: Non - Ferrous Metals
  • ISIN: INE976T01013
  • NSEID: SAGARDEEP
  • BSEID:
INR
23.66
-0.1 (-0.42%)
BSENSE

Sep 02, 03:50 PM

BSE+NSE Vol: 2274

  • Price Points
  • Score
  • Mojo Parameters
  • Total Return
  • News and Corporate Actions
  • Key factors
  • Shareholding
  • Financials
  • CompanyCV
stock-summaryPrice Point
High/Low

1Day

52 Week

Valuation
Technical
Day's Volume

CASH

2.27 k (-84.31%) Volume

Shareholding (Jun 2026)

FII

0.00%

Held by 0 FIIs

DII

0.00%

Held by 0 DIIs

Promoter

72.69%

Why is Sagardeep Alloys Ltd falling/rising?

02-Sep-2026

As of 01-Sep, Sagardeep Alloys Ltd's stock price is rising slightly to 23.76, driven by strong recent financial performance. However, the stock has a concerning long-term trend with a year-to-date decline of 15.17% and decreasing investor participation, indicating a mixed outlook.

As of 01-Sep, Sagardeep Alloys Ltd's stock price is rising slightly, with a current price of 23.76, reflecting a change of 0.12 (0.51%) upward. This increase can be attributed to the company's recent positive financial performance, including a significant growth in net profit of 117.65% and an 88.13% increase in net sales over the last six months. Additionally, the company has reported positive results for the last two consecutive quarters, which may have bolstered investor confidence.<BR><BR>Despite this short-term rise, the stock has shown a concerning long-term trend, with a year-to-date decline of 15.17% and a one-year return of -14.35%. The stock has also underperformed compared to the benchmark Sensex, which has seen a smaller decline of 7.94% year-to-date. Furthermore, the stock's performance over the past three years has been particularly poor, with a decline of 9.31%, while the Sensex has increased by 23.77% during the same period.<BR><BR>Investor participation appears to be falling, as indicated by a significant drop in delivery volume, which decreased by 71.98% compared to the five-day average. This decline in trading activity may suggest a lack of confidence among investors despite the recent positive financial results.<BR><BR>In summary, while Sagardeep Alloys Ltd is experiencing a slight rise in stock price due to recent positive financial indicators, the overall long-term performance and declining investor participation present a mixed outlook for the stock.

View full answer

Which are the latest news on Sagardeep Alloys?

02-Sep-2026

Who are in the management team of Sagardeep Alloys?

01-Sep-2026

The management team of Sagardeep Alloys includes Satishkumar Asamal Mehta (Chairman & Managing Director), Jayeshkumar Ashmal Mehta (Whole-time Director), Hemendra Bhailal Patel, Vinita Pankaj Maheshwari, and Manan Gajjar (Independent Directors), Parimal Patwa (Director), and Ami Doshi (Company Secretary & Compliance Officer). They oversee the company's operations and strategic direction.

The management team of Sagardeep Alloys includes the following individuals:<BR><BR>1. **Satishkumar Asamal Mehta** - Chairman & Managing Director<BR>2. **Jayeshkumar Ashmal Mehta** - Whole-time Director<BR>3. **Hemendra Bhailal Patel** - Independent Director<BR>4. **Vinita Pankaj Maheshwari** - Independent Director<BR>5. **Parimal Patwa** - Director<BR>6. **Ami Doshi** - Company Secretary & Compliance Officer<BR>7. **Manan Gajjar** - Independent Director<BR><BR>This team is responsible for overseeing the company's operations and strategic direction.

View full answer

What does Sagardeep Alloys do?

01-Sep-2026

Sagardeep Alloys Ltd is a Micro Cap company in the Non-Ferrous Metals industry, incorporated in 2007 and converted to a public company in 2012. As of June 2026, it reported net sales of 57 Cr and a net profit of 1 Cr, with a market cap of INR 42 Cr.

Overview: <BR>Sagardeep Alloys Ltd operates in the Non-Ferrous Metals industry and is categorized as a Micro Cap company.<BR><BR>History: <BR>Sagardeep Alloys Limited was originally incorporated as "Sagardeep Alloyes Private Limited" in 2007. The company underwent a name change to Sagardeep Alloys Private Limited in 2009 and later converted to a Public Limited Company, receiving a fresh Certificate of Incorporation in 2012. The latest quarterly results report net sales and profit for June 2026.<BR><BR>Financial Snapshot: <BR>Net Sales: 57 Cr (Quarterly Results - Jun 2026) <BR>Net Profit: 1 Cr (Quarterly Results - Jun 2026) <BR>Market Cap: INR 42 Cr (Micro Cap)<BR><BR>Key Metrics: <BR>P/E: 14.00 <BR>Industry P/E: 14 <BR>Dividend Yield: 0.00% <BR>Debt-Equity: 0.26 <BR>Return on Equity: 7.00% <BR>Price to Book: 1.14 <BR><BR>Contact Details: <BR>Address: Plot No 2070 Rajnagar patia, Santej Khatraj Road santejkala Gandhinagar Gujarat : 382721 <BR>Tel: 91-79-25626304/25626335 <BR>Fax: 91-79-25626535 <BR>Email: secretary@sdalloys.com <BR>Website: http://www.sdalloys.com

View full answer

Who are the peers of the Sagardeep Alloys?

01-Sep-2026

Peers of Sagardeep Alloys include Ashoka Metcast, Sacheta Metals, Nanavati Venture, RR Metalmakers, Sudal Industries, Aeonx Digital, Palco Metals Ltd, and Hind Aluminium. Sagardeep Alloys has below average management risk and growth, with a 1-year return of -15.36%, the lowest among its peers.

Peers: The peers of Sagardeep Alloys are Ashoka Metcast, Sacheta Metals, Nanavati Venture, RR Metalmakers, Sudal Industries, Aeonx Digital, Palco Metals Ltd, and Hind Aluminium.<BR><BR>Quality Snapshot: Below Average management risk is observed at Sagardeep Alloys, Ashoka Metcast, Sacheta Metals, Nanavati Venture, Sudal Industries, and Hind Aluminium, while Average management risk is found at RR Metalmakers and Aeonx Digital. Average growth is noted at Sagardeep Alloys and RR Metalmakers, while Below Average growth is seen at Ashoka Metcast, Sacheta Metals, Nanavati Venture, Sudal Industries, Aeonx Digital, and Hind Aluminium, with Good growth at Palco Metals Ltd. Capital Structure ratings show Below Average at Sagardeep Alloys, Ashoka Metcast, Sacheta Metals, RR Metalmakers, and Hind Aluminium, Good at Nanavati Venture and Sudal Industries, and Excellent at Palco Metals Ltd.<BR><BR>Return Snapshot: The peer with the highest 1-year return is Sacheta Metals at 0.00%, while the lowest is Sagardeep Alloys at -15.36%. Sagardeep Alloys' 1-year return is significantly lower than the highest peer return. Additionally, Ashoka Metcast, RR Metalmakers, Sudal Industries, Aeonx Digital, Palco Metals Ltd, and Hind Aluminium all have negative six-month returns.

View full answer

How big is Sagardeep Alloys?

01-Sep-2026

As of 31st August, Sagardeep Alloys Ltd has a market capitalization of 42.00 Cr, with recent net sales of 200.31 Cr and a net profit of 3.08 Cr. The balance sheet for March 2025 shows shareholder's funds of 29.99 Cr and total assets of 40.00 Cr.

As of 31st August, Sagardeep Alloys Ltd has a market capitalization of 42.00 Cr, which categorizes it as a Micro Cap company.<BR><BR>In the latest four quarters, Sagardeep Alloys reported Net Sales of 200.31 Cr and a Net Profit of 3.08 Cr.<BR><BR>The latest annual period for the balance sheet is March 2025, showing Shareholder's Funds of 29.99 Cr and Total Assets of 40.00 Cr.

View full answer

Should I buy, sell or hold Sagardeep Alloys Ltd?

13-Aug-2026

Are Sagardeep Alloys Ltd latest results good or bad?

11-Aug-2026

Sagardeep Alloys Ltd's latest quarterly results are strong, with a net profit increase of 406.25% and significant revenue growth. However, concerns about long-term capital efficiency and a "SELL" advisory rating suggest investors should be cautious about the sustainability of this performance.

Sagardeep Alloys Ltd's latest results present a mixed picture. On one hand, the company achieved impressive quarterly performance in Q4 FY26, with a net profit of ₹1.62 crores, marking a remarkable 406.25% increase quarter-on-quarter. Revenue also surged to ₹70.45 crores, reflecting a 117.17% year-on-year growth and an all-time quarterly high. The operating margin improved to 4.27%, indicating better cost management and operational efficiency.<BR><BR>However, despite these strong short-term results, there are significant concerns regarding the company's long-term capital efficiency. The five-year average return on capital employed (ROCE) is only 3.99%, and the return on equity (ROE) averages 4.17%, both of which are considered weak. Additionally, the company has a current advisory rating of "SELL" and an overall score of 46 out of 100, suggesting that investors should be cautious.<BR><BR>The absence of institutional interest and the volatility in earnings further complicate the outlook. While the recent performance is commendable, the underlying issues indicate that investors should approach with caution, as the sustainability of this growth remains uncertain. Overall, while the quarterly results are good, the long-term prospects raise red flags.

View full answer

Is Sagardeep Alloys overvalued or undervalued?

18-Nov-2025

As of November 17, 2025, Sagardeep Alloys is fairly valued with a PE ratio of 21.27, an EV to EBITDA of 49.30, and a PEG ratio of 0.18, despite underperforming the market with a year-to-date return of -7.06% compared to the Sensex's 10.02% gain.

As of 17 November 2025, the valuation grade for Sagardeep Alloys has moved from very attractive to fair. The company appears to be fairly valued based on its current metrics. Key ratios include a PE ratio of 21.27, an EV to EBITDA of 49.30, and a PEG ratio of 0.18, which suggests that the stock is reasonably priced relative to its growth potential.<BR><BR>In comparison to its peers, Sagardeep Alloys' PE ratio stands higher than Vedanta's 15.12 but lower than Hindustan Zinc's 19.35, indicating a competitive positioning within the non-ferrous metals industry. Notably, while Sagardeep's ROE is 6.83%, it lags behind many peers, which may affect investor sentiment. The company's recent stock performance has been underwhelming, with a year-to-date return of -7.06%, contrasting sharply with the Sensex's gain of 10.02% over the same period, further reinforcing the notion of fair valuation amidst broader market trends.

View full answer

How has been the historical performance of Sagardeep Alloys?

12-Nov-2025

Sagardeep Alloys has shown strong financial growth, with net sales increasing to 124.95 Cr in Mar'25 and profit before tax rising to 2.57 Cr. Despite higher raw material costs, the company maintained a positive operating profit and improved earnings per share to 1.17, while cash flow from operations reached 3.00 Cr.

Answer:<BR>The historical performance of Sagardeep Alloys shows a progressive increase in net sales and profit over the years, with net sales reaching 124.95 Cr in Mar'25, up from 99.78 Cr in Mar'24 and 87.08 Cr in Mar'23. The total operating income also reflects this upward trend, peaking at 124.95 Cr in Mar'25. Despite rising raw material costs, which were 97.12 Cr in Mar'25 compared to 85.83 Cr in Mar'24, the company managed to maintain a positive operating profit of 2.15 Cr in Mar'25, slightly up from 1.92 Cr in Mar'24. Profit before tax significantly increased to 2.57 Cr in Mar'25 from 0.95 Cr in the previous year, leading to a profit after tax of 1.92 Cr, up from 0.76 Cr in Mar'24. The earnings per share also improved to 1.17 in Mar'25 from 0.46 in Mar'24. However, total liabilities decreased to 40.00 Cr in Mar'25 from 41.78 Cr in Mar'24, while total assets also fell to 40.00 Cr from 41.78 Cr, indicating a tightening balance sheet. Cash flow from operating activities showed a positive trend, reaching 3.00 Cr in Mar'25, up from 2.00 Cr in Mar'24.<BR><BR>Breakdown:<BR>Sagardeep Alloys has demonstrated a strong growth trajectory in its financial performance over the years. The net sales have consistently increased, culminating in 124.95 Cr in Mar'25, which is a significant rise from 99.78 Cr in Mar'24. This growth in sales has translated into improved profitability, with profit before tax soaring to 2.57 Cr in Mar'25 from 0.95 Cr in Mar'24, and profit after tax reaching 1.92 Cr, up from 0.76 Cr. The company's earnings per share also reflect this positive trend, increasing to 1.17 in Mar'25. On the expenditure side, raw material costs have risen but were managed effectively, allowing for an operating profit of 2.15 Cr in Mar'25. Despite a decrease in total assets and liabilities, the company has maintained a healthy cash flow from operating activities, which reached 3.00 Cr in Mar'25, indicating robust operational efficiency.

View full answer

How has been the historical performance of Sagardeep Alloys?

12-Nov-2025

Sagardeep Alloys has experienced significant growth in net sales and profit from March 2023 to March 2025, with net sales increasing from 87.08 crore to 124.95 crore and profit after tax rising from 0.55 crore to 1.92 crore, indicating improved operational efficiency and financial stability.

Answer:<BR>The historical performance of Sagardeep Alloys shows a significant increase in net sales and profit over the years, particularly from March 2023 to March 2025.<BR><BR>Breakdown:<BR>Sagardeep Alloys has demonstrated a strong upward trend in net sales, rising from 87.08 crore in March 2023 to 124.95 crore in March 2025. This growth is accompanied by an increase in total operating income, which reached 124.95 crore in March 2025, up from 87.08 crore in March 2023. The company's total expenditure also increased, amounting to 122.80 crore in March 2025, reflecting rising raw material costs and other expenses. Despite this, the operating profit (PBDIT) improved to 4.45 crore in March 2025 from 2.06 crore in March 2023, indicating better operational efficiency. Profit before tax surged to 2.57 crore in March 2025, compared to 0.77 crore in March 2023, while profit after tax also rose to 1.92 crore from 0.55 crore in the same period. The earnings per share (EPS) increased significantly from 0.33 in March 2023 to 1.17 in March 2025, showcasing enhanced profitability. On the balance sheet, total assets decreased slightly to 40.00 crore in March 2025 from 41.78 crore in March 2024, while total liabilities also fell to 40.00 crore from 41.78 crore, indicating improved financial stability. Overall, Sagardeep Alloys has shown a positive trajectory in both revenue and profitability metrics over the past few years.

View full answer

Who are the top shareholders of the Sagardeep Alloys?

17-Jul-2025

The top shareholder of Sagardeep Alloys is Jayeshkumar Ashmal Mehta, holding 15.4%. Individual investors collectively own 23.81%, while the highest public shareholder is Inani Sureshkumar R at 2.77%.

The top shareholders of Sagardeep Alloys include the promoters, with Jayeshkumar Ashmal Mehta holding the highest stake at 15.4%. There are no pledged promoter holdings, and the company does not have any mutual funds or foreign institutional investors (FIIs) holding shares. The highest public shareholder is Inani Sureshkumar R, who holds 2.77%. Additionally, individual investors collectively hold 23.81% of the shares.

View full answer

What is the technical trend for Sagardeep Alloys?

09-Jun-2025

As of April 30, 2025, Sagardeep Alloys exhibits a mildly bullish trend overall, supported by daily moving averages and a bullish monthly MACD, despite mixed signals from weekly indicators.

As of 30 April 2025, the technical trend for Sagardeep Alloys has changed from bullish to mildly bullish. The weekly MACD is mildly bearish, while the monthly MACD remains bullish, indicating mixed signals. The Bollinger Bands also show a mildly bearish stance on the weekly chart but bullish on the monthly. Daily moving averages are bullish, supporting the mildly bullish trend. The Dow Theory presents a mildly bullish outlook on the weekly timeframe but is mildly bearish on the monthly. Overall, the current technical stance is mildly bullish, driven primarily by the daily moving averages and monthly MACD, despite some bearish signals on the weekly indicators.

View full answer

When is the next results date for Sagardeep Alloys?

06-Jun-2025

No Upcoming Board Meetings

What is the bonus history of the Sagardeep Alloys?

06-Jun-2025

Sagardeep Alloys announced a 1:2 bonus issue on October 5, 2020, with a record date of October 6, 2020, meaning shareholders received one additional share for every two shares held.

Sagardeep Alloys has a bonus history that includes a 1:2 bonus issue announced on October 5, 2020. The record date for this bonus was October 6, 2020. This means that for every two shares held, shareholders received one additional share as a bonus.

View full answer

Has Sagardeep Alloys declared dividend?

06-Jun-2025

No Dividend History Available

iScoreScore
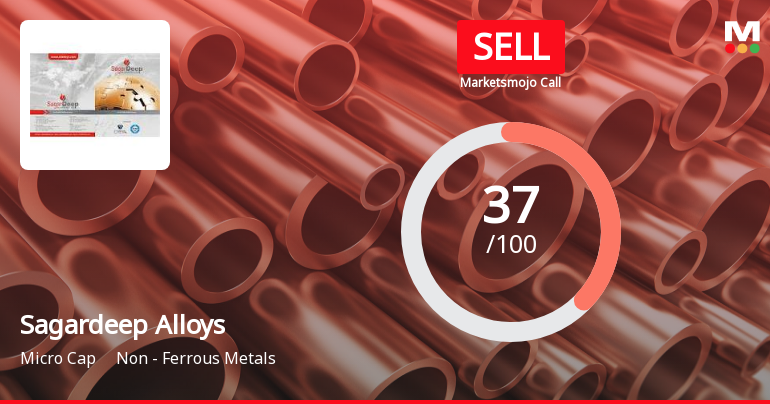
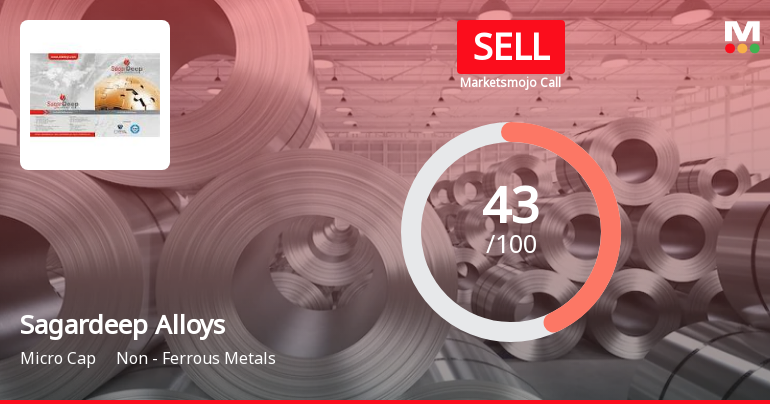
Click here to find our call on this stock
Strong Sell
Sell
Hold
Buy
Strong Buy

Dashboard

1

Weak Long Term Fundamental Strength with an average Return on Capital Employed (ROCE) of 4.63%

  • Company's ability to service its debt is weak with a poor EBIT to Interest (avg) ratio of 1.88
2

Below par performance in long term as well as near term

stock-summaryMojo Parameters

Mojo Parameters

Loading Valuation Snapshot...

Stock DNA

stock-summary
Industry

Non - Ferrous Metals

stock-summary
Market cap

INR 41 Cr (Micro Cap)

stock-summary
P/E

14.00

stock-summary
Industry P/E

NA

stock-summary
Dividend Yield

0.00%

stock-summary
Debt Equity

0.26

stock-summary
Return on Equity

7.00%

stock-summary
Price to Book

1.15

Revenue and Profits:
Net Sales:
57 Cr
(Quarterly Results - Jun 2026)
Net Profit:
1 Cr
stock-summaryTotal Returns
Total Returns (Price + Dividend) stock-summary
Dividend Yield (0%)
TimePeriod
Price Return
Dividend Return
Total Return
3 Months
-7.72%
0%
-7.72%
6 Months
0.42%
0%
0.42%
1 Year
-13.3%
0%
-13.3%
2 Years
-16.45%
0%
-16.45%
3 Years
-9.69%
0%
-9.69%
4 Years
-22.17%
0%
-22.17%
5 Years
-39.87%
0%
-39.87%

Sagardeep Alloys for the last several years.

Risk Adjusted Returns v/s stock-summary
Returns Beta
Icon
Beta has not been calculated since enough price history is not available
stock-summaryNews & Corporate Actions

News

Announcements stock-summary

Sagardeep Alloys Limited - Outcome of Board Meeting

15-Nov-2019 | Source : NSE

Sagardeep Alloys Limited has informed the Exchange regarding Board meeting held on November 14, 2019.

Sagardeep Alloys Limited - Shareholders meeting

25-Sep-2019 | Source : NSE

Sagardeep Alloys Limited has informed the Exchange regarding Proceedings of Annual General Meeting held on September 25, 2019

Shareholders meeting

31-Aug-2019 | Source : NSE

Sagardeep Alloys Limited has informed the Exchange regarding Notice of Annual General Meeting to be held on September 25, 2019

Corporate Actions stock-summary

stock-summary
BOARD MEETING

No Upcoming Board Meetings

stock-summary
DIVIDEND

No Dividend history available

stock-summary
SPLITS

No Splits history available

stock-summary
BONUS

Sagardeep Alloys Ltd has announced 1:2 bonus issue, ex-date: 05 Oct 20

stock-summary
RIGHTS

No Rights history available

stock-summaryKey Factors

Quality key factors stock-summary

Factor
Value
Sales Growth (5y)
21.75%
EBIT Growth (5y)
21.49%
EBIT to Interest (avg)
1.88
Debt to EBITDA (avg)
6.32
Net Debt to Equity (avg)
0.26
Sales to Capital Employed (avg)
2.65
Tax Ratio
28.31%
Dividend Payout Ratio
0
Pledged Shares
0
Institutional Holding
0
ROCE (avg)
3.99%
ROE (avg)
3.52%

Valuation key factors

Factor
Value
P/E Ratio
14
Industry P/E
Price to Book Value
1.15
EV to EBIT
11.05
EV to EBITDA
9.85
EV to Capital Employed
1.12
EV to Sales
0.25
PEG Ratio
0.11
Dividend Yield
NA
ROCE (Latest)
8.08%
ROE (Latest)
7.00%

Technicals key factors

Indicator
Weekly
Monthly
MACD
Bearish
Bearish
RSI
No Signal
No Signal
Bollinger Bands
Sideways
Mildly Bearish
Moving Averages
Bearish (Daily)
KST
Bearish
Bearish
Dow Theory
No Trend
No Trend
OBV
No Trend
No Trend
stock-summary Technical Indicator Scale: Bearish, Mildly Bearish, Sideways, Mildly Bullish, Bullish  Turned 
stock-summaryShareholding
Shareholding Snapshot : Jun 2026stock-summary
Shareholding Compare (%holding) stock-summary
Majority shareholders

Promoters

Pledged Promoter Holdings

None

Mutual Funds

Held by 0 Schemes

FIIs

Held by 0 FIIs

Promoter with highest holding

Jayeshkumar Ashmal Mehta (15.4%)

Highest Public shareholder

Inani Sureshkumar R (4.32%)

Individual Investors Holdings

25.89%

stock-summaryFinancial
[
  {
    "link": "quarterly",
    "btn_text": "All Quarterly Results",
    "header": "Quarterly Results Snapshot (Consolidated) - Jun'26 - YoY",
    "rhs": [
      {
        "prefix": "Net Sales ",
        "suffix": "YoY Growth in quarter ended Jun 2026 is 61.47% vs 17.13% in Jun 2025",
        "dir": 1
      },
      {
        "prefix": "Consolidated Net Profit ",
        "suffix": "YoY Growth in quarter ended Jun 2026 is 117.65% vs 47.83% in Jun 2025",
        "dir": 1
      }
    ],
    "table": {
      "header": [
        "Jun'26",
        "Jun'25",
        "Change(%)"
      ],
      "body": [
        {
          "field": "Net Sales",
          "val1": "57.08",
          "val2": "35.35",
          "chgp": "61.47%",
          "chgp_class": "positive"
        },
        {
          "field": "Operating Profit (PBDIT) excl Other Income",
          "val1": "1.42",
          "val2": "0.52",
          "chgp": "173.08%",
          "chgp_class": "positive"
        },
        {
          "field": "Interest",
          "val1": "0.36",
          "val2": "0.16",
          "chgp": "125.00%",
          "chgp_class": "negative"
        },
        {
          "field": "Exceptional Items",
          "val1": "0.00",
          "val2": "0.00",
          "chgp": "",
          "chgp_class": "neutral"
        },
        {
          "field": "Consolidate Net Profit",
          "val1": "0.74",
          "val2": "0.34",
          "chgp": "117.65%",
          "chgp_class": "positive"
        },
        {
          "field": "Operating Profit Margin (Excl OI)",
          "val1": "2.49%",
          "val2": "1.47%",
          "chgp": "1.02%",
          "chgp_class": "positive"
        }
      ]
    }
  },
  {
    "link": "half-yearly",
    "btn_text": "All Half Yearly Results",
    "header": "Half Yearly Results Snapshot (Consolidated) - Sep'25",
    "rhs": [
      {
        "prefix": "Net Sales ",
        "suffix": " Growth in half year ended Sep 2025 is 5.53% vs 46.92% in Sep 2024",
        "dir": -1
      },
      {
        "prefix": "Consolidated Net Profit ",
        "suffix": " Growth in half year ended Sep 2025 is 33.93% vs 60.00% in Sep 2024",
        "dir": -1
      }
    ],
    "table": {
      "header": [
        "Sep'25",
        "Sep'24",
        "Change(%)"
      ],
      "body": [
        {
          "field": "Net Sales",
          "val1": "68.93",
          "val2": "65.32",
          "chgp": "5.53%",
          "chgp_class": "positive"
        },
        {
          "field": "Operating Profit (PBDIT) excl Other Income",
          "val1": "0.66",
          "val2": "1.61",
          "chgp": "-59.01%",
          "chgp_class": "negative"
        },
        {
          "field": "Interest",
          "val1": "0.40",
          "val2": "0.74",
          "chgp": "-45.95%",
          "chgp_class": "positive"
        },
        {
          "field": "Exceptional Items",
          "val1": "0.00",
          "val2": "0.00",
          "chgp": "",
          "chgp_class": "neutral"
        },
        {
          "field": "Consolidate Net Profit",
          "val1": "0.75",
          "val2": "0.56",
          "chgp": "33.93%",
          "chgp_class": "positive"
        },
        {
          "field": "Operating Profit Margin (Excl OI)",
          "val1": "0.96%",
          "val2": "2.46%",
          "chgp": "-1.50%",
          "chgp_class": "negative"
        }
      ]
    }
  },
  {
    "link": "nine-monthly",
    "btn_text": "All Nine Monthly Results",
    "header": "Nine Monthly Results Snapshot (Consolidated) - Dec'25",
    "rhs": [
      {
        "prefix": "Net Sales ",
        "suffix": "YoY Growth in nine months ended Dec 2025 is 16.66% vs 31.59% in Dec 2024",
        "dir": -1
      },
      {
        "prefix": "Consolidated Net Profit ",
        "suffix": "YoY Growth in nine months ended Dec 2025 is 25.88% vs 70.00% in Dec 2024",
        "dir": -1
      }
    ],
    "table": {
      "header": [
        "Dec'25",
        "Dec'24",
        "Change(%)"
      ],
      "body": [
        {
          "field": "Net Sales",
          "val1": "108.13",
          "val2": "92.69",
          "chgp": "16.66%",
          "chgp_class": "positive"
        },
        {
          "field": "Operating Profit (PBDIT) excl Other Income",
          "val1": "1.14",
          "val2": "1.90",
          "chgp": "-40.00%",
          "chgp_class": "negative"
        },
        {
          "field": "Interest",
          "val1": "0.63",
          "val2": "0.96",
          "chgp": "-34.37%",
          "chgp_class": "positive"
        },
        {
          "field": "Exceptional Items",
          "val1": "0.33",
          "val2": "0.00",
          "chgp": "",
          "chgp_class": "neutral"
        },
        {
          "field": "Consolidate Net Profit",
          "val1": "1.07",
          "val2": "0.85",
          "chgp": "25.88%",
          "chgp_class": "positive"
        },
        {
          "field": "Operating Profit Margin (Excl OI)",
          "val1": "1.05%",
          "val2": "2.05%",
          "chgp": "-1.00%",
          "chgp_class": "negative"
        }
      ]
    }
  },
  {
    "link": "annual",
    "btn_text": "All Annual Results",
    "header": "Annual Results Snapshot (Consolidated) - Mar'26",
    "rhs": [
      {
        "prefix": "Net Sales ",
        "suffix": "YoY Growth in year ended Mar 2026 is 42.32% vs 25.75% in Mar 2025",
        "dir": 1
      },
      {
        "prefix": "Consolidated Net Profit ",
        "suffix": "YoY Growth in year ended Mar 2026 is 40.10% vs 152.63% in Mar 2025",
        "dir": -1
      }
    ],
    "table": {
      "header": [
        "Mar'26",
        "Mar'25",
        "Change(%)"
      ],
      "body": [
        {
          "field": "Net Sales",
          "val1": "178.57",
          "val2": "125.47",
          "chgp": "42.32%",
          "chgp_class": "positive"
        },
        {
          "field": "Operating Profit (PBDIT) excl Other Income",
          "val1": "4.15",
          "val2": "2.67",
          "chgp": "55.43%",
          "chgp_class": "positive"
        },
        {
          "field": "Interest",
          "val1": "0.79",
          "val2": "1.22",
          "chgp": "-35.25%",
          "chgp_class": "positive"
        },
        {
          "field": "Exceptional Items",
          "val1": "0.33",
          "val2": "0.93",
          "chgp": "-64.52%",
          "chgp_class": "negative"
        },
        {
          "field": "Consolidate Net Profit",
          "val1": "2.69",
          "val2": "1.92",
          "chgp": "40.10%",
          "chgp_class": "positive"
        },
        {
          "field": "Operating Profit Margin (Excl OI)",
          "val1": "2.32%",
          "val2": "2.13%",
          "chgp": "0.19%",
          "chgp_class": "positive"
        }
      ]
    }
  }
]

Quarterly Results Snapshot (Consolidated) - Jun'26 - YoYstock-summary

Jun'26
Jun'25
Change(%)
Net Sales
57.08
35.35
61.47%
Operating Profit (PBDIT) excl Other Income
1.42
0.52
173.08%
Interest
0.36
0.16
125.00%
Exceptional Items
0.00
0.00
Consolidate Net Profit
0.74
0.34
117.65%
Operating Profit Margin (Excl OI)
2.49%
1.47%
1.02%
Values in Rs Cr.
Direction Arrows
Net Sales

YoY Growth in quarter ended Jun 2026 is 61.47% vs 17.13% in Jun 2025

Direction Arrows
Consolidated Net Profit

YoY Growth in quarter ended Jun 2026 is 117.65% vs 47.83% in Jun 2025

Half Yearly Results Snapshot (Consolidated) - Sep'25stock-summary

Sep'25
Sep'24
Change(%)
Net Sales
68.93
65.32
5.53%
Operating Profit (PBDIT) excl Other Income
0.66
1.61
-59.01%
Interest
0.40
0.74
-45.95%
Exceptional Items
0.00
0.00
Consolidate Net Profit
0.75
0.56
33.93%
Operating Profit Margin (Excl OI)
0.96%
2.46%
-1.50%
Values in Rs Cr.
Direction Arrows
Net Sales

Growth in half year ended Sep 2025 is 5.53% vs 46.92% in Sep 2024

Direction Arrows
Consolidated Net Profit

Growth in half year ended Sep 2025 is 33.93% vs 60.00% in Sep 2024

Nine Monthly Results Snapshot (Consolidated) - Dec'25stock-summary

Dec'25
Dec'24
Change(%)
Net Sales
108.13
92.69
16.66%
Operating Profit (PBDIT) excl Other Income
1.14
1.90
-40.00%
Interest
0.63
0.96
-34.37%
Exceptional Items
0.33
0.00
Consolidate Net Profit
1.07
0.85
25.88%
Operating Profit Margin (Excl OI)
1.05%
2.05%
-1.00%
Values in Rs Cr.
Direction Arrows
Net Sales

YoY Growth in nine months ended Dec 2025 is 16.66% vs 31.59% in Dec 2024

Direction Arrows
Consolidated Net Profit

YoY Growth in nine months ended Dec 2025 is 25.88% vs 70.00% in Dec 2024

Annual Results Snapshot (Consolidated) - Mar'26stock-summary

Mar'26
Mar'25
Change(%)
Net Sales
178.57
125.47
42.32%
Operating Profit (PBDIT) excl Other Income
4.15
2.67
55.43%
Interest
0.79
1.22
-35.25%
Exceptional Items
0.33
0.93
-64.52%
Consolidate Net Profit
2.69
1.92
40.10%
Operating Profit Margin (Excl OI)
2.32%
2.13%
0.19%
Values in Rs Cr.
Direction Arrows
Net Sales

YoY Growth in year ended Mar 2026 is 42.32% vs 25.75% in Mar 2025

Direction Arrows
Consolidated Net Profit

YoY Growth in year ended Mar 2026 is 40.10% vs 152.63% in Mar 2025

stock-summaryCompany CV
About Sagardeep Alloys Ltd stock-summary
stock-summary
Sagardeep Alloys Ltd
Micro Cap
Non - Ferrous Metals
Sagardeep Alloys Limited was originally incorporated as "Sagardeep Alloyes Private Limited" on February 13, 2007 by Registrar of Companies, Gujarat, at Ahmedabad. The name of the Company was changed to Sagardeep Alloys Private Limited on June 25, 2009. Thereafter, once again a fresh Certificate of Incorporation, upon change of name on conversion of the Company to Public Limited Company in the name of the "Sagardeep Alloys Limited" was granted by ROC on April 17, 2012.
Company Coordinates stock-summary
Company Details
Plot No 2070 Rajnagar patia, Santej Khatraj Road santejkala Gandhinagar Gujarat : 382721
stock-summary
Tel: 91-79-25626304/25626335
stock-summary
secretary@sdalloys.com
Registrar Details
Link Intime India Pvt Ltd, C-13 Pannalal Silk Compound, L B S Marg, Bhandup , Mumbai