
Compare Sagility with Similar Stocks
Dashboard
Strong Long Term Fundamental Strength with a 84.92% CAGR growth in Operating Profits
Healthy long term growth as Operating profit has grown by an annual rate of 84.92%
The company has declared Positive results for the last 7 consecutive quarters
With ROE of 9.8, it has a Attractive valuation with a 2.2 Price to Book Value
100% of Promoter Shares are Pledged
Stock DNA
Computers - Software & Consulting
INR 20,317 Cr (Small Cap)
21.00
32
0.00%
0.12
9.84%
2.23
Total Returns (Price + Dividend) 
Latest dividend: 0 per share ex-dividend date: Nov-12-2025
Risk Adjusted Returns v/s
Returns Beta

News
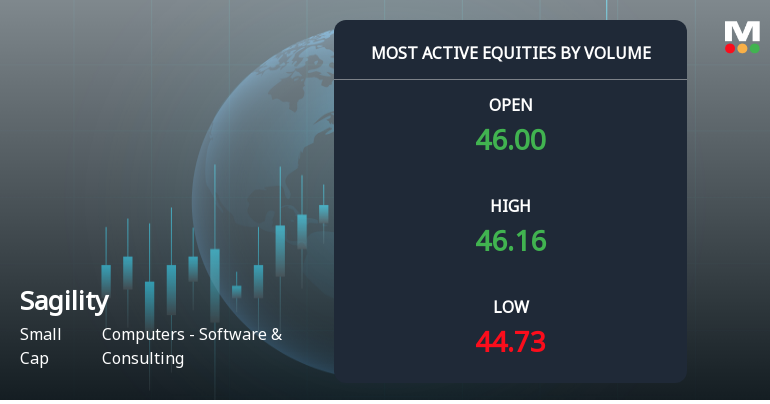
Sagility Ltd Sees Exceptional Volume Amid Mixed Market Signals
Sagility Ltd, a small-cap player in the Computers - Software & Consulting sector, witnessed one of the highest trading volumes on 31 Jul 2026, with over 72.5 lakh shares exchanging hands. Despite this surge in activity, the stock underperformed its sector and closed lower, reflecting a complex interplay of investor sentiment and technical signals.
Read full news article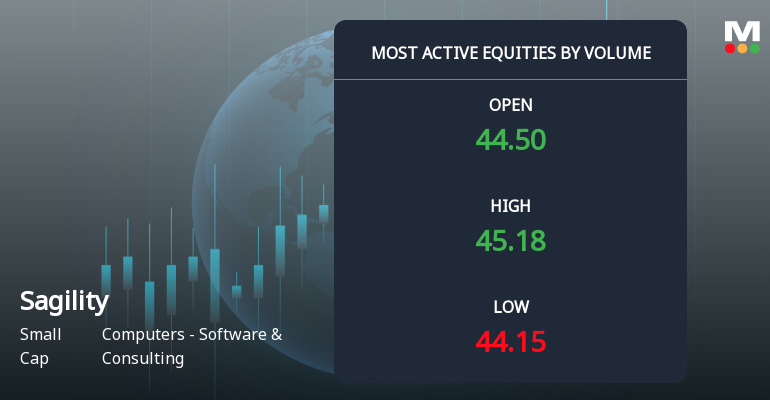
Sagility Ltd Sees Exceptional Volume Surge Amid Positive Momentum
Sagility Ltd, a small-cap player in the Computers - Software & Consulting sector, has emerged as one of the most actively traded stocks by volume on 30 July 2026, reflecting renewed investor interest and a notable shift in market sentiment. The stock’s volume surge, combined with its recent price performance and technical indicators, signals a potential accumulation phase that market participants should closely monitor.
Read full news article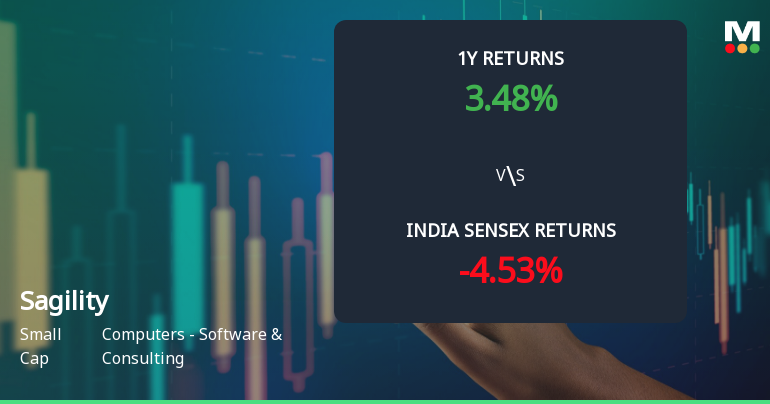
Sagility Ltd Technical Momentum Shifts Signal Mild Bullish Outlook
Sagility Ltd, a small-cap player in the Computers - Software & Consulting sector, has recently exhibited a notable shift in its technical momentum, moving from a sideways trend to a mildly bullish stance. This change is underscored by improvements in key technical indicators such as the MACD and Bollinger Bands on weekly charts, alongside a recent upgrade in its Mojo Grade from Sell to Hold, signalling cautious optimism among market participants.
Read full news article Announcements
Corporate Actions

No Upcoming Board Meetings

Sagility Ltd has declared 1% dividend, ex-date: 07 Aug 26

No Splits history available

No Bonus history available

No Rights history available
Quality key factors
Valuation key factors
Technicals key factors
 Technical Indicator Scale: Bearish, Mildly Bearish, Sideways, Mildly Bullish, Bullish Turned
 Shareholding Snapshot : Jun 2026
Shareholding Compare (%holding)
Promoters
100
Held by 32 Schemes (13.45%)
Held by 123 FIIs (9.99%)
Sagility B.v (50.95%)
Icici Prudential Technology Fund (3.48%)
14.53%
Quarterly Results Snapshot (Consolidated) - Jun'26 - QoQ

QoQ Growth in quarter ended Jun 2026 is -3.00% vs 2.69% in Mar 2026
QoQ Growth in quarter ended Jun 2026 is -15.88% vs -3.71% in Mar 2026
Half Yearly Results Snapshot (Consolidated) - Sep'25

Growth in half year ended Sep 2025 is 25.47% vs 15.30% in Sep 2024
Growth in half year ended Sep 2025 is 186.01% vs 80.27% in Sep 2024
Nine Monthly Results Snapshot (Consolidated) - Dec'25
YoY Growth in nine months ended Dec 2025 is 29.17% vs 15.30% in Dec 2024
YoY Growth in nine months ended Dec 2025 is 87.08% vs 140.81% in Dec 2024
Annual Results Snapshot (Consolidated) - Mar'26
YoY Growth in year ended Mar 2026 is 29.14% vs 17.17% in Mar 2025
YoY Growth in year ended Mar 2026 is 71.53% vs 136.18% in Mar 2025
About Sagility Ltd

Company Coordinates


