SAIL

  • Market Cap: Mid Cap
  • Industry: Ferrous Metals
  • ISIN: INE114A01011
  • NSEID: SAIL
  • BSEID: 500113
INR
174.35
-0.5 (-0.29%)
BSENSE

Aug 21, 11:59 AM

BSE+NSE Vol: 75.6 lacs

  • Price Points
  • Score
  • Mojo Parameters
  • Total Return
  • News and Corporate Actions
  • Key factors
  • Shareholding
  • Financials
  • CompanyCV
stock-summaryPrice Point
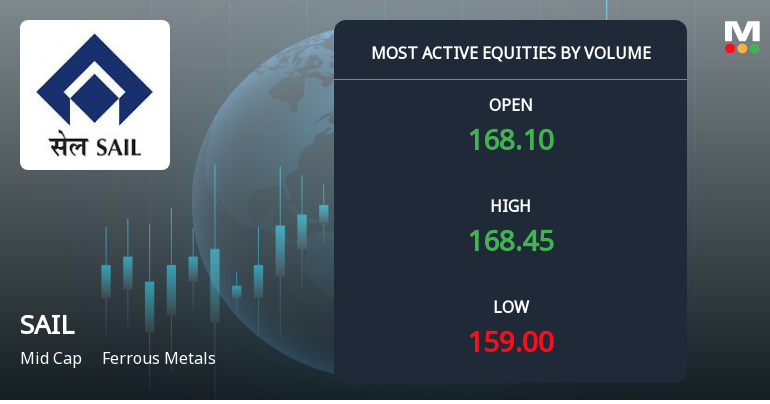
High/Low

1Day

52 Week

Valuation
Technical
Day's Volume

CASH

75.6 lacs (-10.53%) Volume

Shareholding (Jun 2026)

FII

7.09%

Held by 307 FIIs

DII

16.86%

Held by 132 DIIs

Promoter

65.00%

Why is Steel Authority Of India Ltd. falling/rising?

21-Aug-2026

As of 20-Aug, Steel Authority Of India Ltd. is seeing a stock price increase to 174.85, driven by strong financial results, a 94.98% growth in net profit, and attractive valuation metrics. The stock has outperformed the Sensex recently, reflecting positive investor sentiment and confidence.

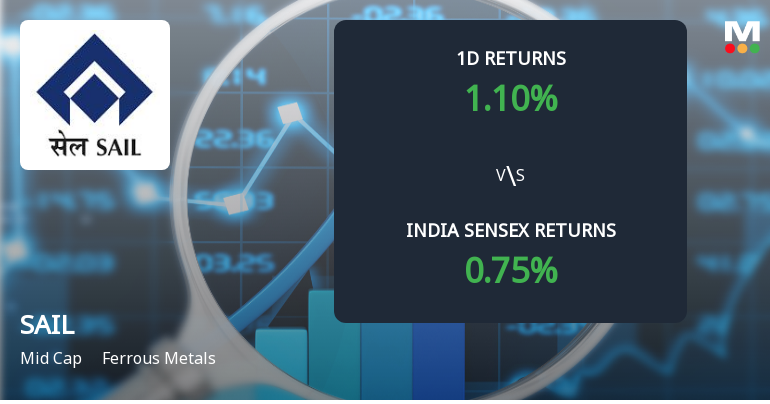
As of 20-Aug, Steel Authority Of India Ltd. is experiencing a rise in its stock price, currently at 174.85, reflecting an increase of 2.35 (1.36%). This upward movement can be attributed to several positive factors. Over the past week, the stock has outperformed the benchmark Sensex, gaining 4.05% compared to the Sensex's decline of 0.69%. Additionally, the stock has shown a strong performance over the last month with a rise of 7.50%, while the Sensex has only decreased by 0.22%.<BR><BR>The company has reported very positive financial results, including a remarkable 94.98% growth in net profit for the quarter ending June 26. This follows two consecutive quarters of positive results, with significant increases in profit before tax (PBT) and profit after tax (PAT). The return on capital employed (ROCE) is also at a high of 7.94%, indicating efficient use of capital.<BR><BR>Furthermore, the stock is trading at a discount compared to its peers, with a PEG ratio of 0.3, suggesting attractive valuation. The high institutional holdings at 23.95% reflect confidence from larger investors, which can positively influence retail investor sentiment.<BR><BR>Despite a slight decline in delivery volume, the stock has maintained liquidity, making it accessible for trading. Overall, the combination of strong financial performance, attractive valuation, and market-beating returns has contributed to the rising stock price of Steel Authority Of India Ltd.

View full answer

Who are in the management team of SAIL?

14-Aug-2026

The management team of Steel Authority of India Limited (SAIL) includes key members such as Soma Mondal (Chairman), M B Balakrishnan (Company Secretary), and various directors overseeing projects, finance, and operations. This team is responsible for the strategic direction and management of the company.

The management team of Steel Authority of India Limited (SAIL) includes the following key members:<BR><BR>1. **Soma Mondal** - Chairman & Executive Director<BR>2. **M B Balakrishnan** - Company Secretary & Compliance Officer<BR>3. **Anirban Dasgupta** - Director (Projects & Business Planning)<BR>4. **Sukriti Likhi** - Nominee (Government)<BR>5. **Atanu Bhowmick** - Director (Commercial)<BR>6. **Amarendu Prakash** - Whole-time Director<BR>7. **K. Jayaprasad** - Independent Director<BR>8. **Brijendra Pratap Singh** - Director (Incharge)<BR>9. **Abhijit Narendra** - Nominee (Government)<BR>10. **Anil Kumar Tulsiani** - Director (Finance)<BR>11. **Ashok Kumar Tripathy** - Independent Director<BR>12. **Kanhaiya Sarda** - Independent Director<BR>13. **Neelam Sonker** - Independent Director<BR>14. **Sagi Kasi Viswanatha Raju** - Independent Director<BR>15. **Gopal Singh Bhati** - Independent Director<BR>16. **Arvind Kumar Singh** - Director (Technical & Project)<BR>17. **Vijendla SriniVaSa ChakraVarthy** - Director (Commercial)<BR>18. **Krishna Kumar Singh** - Director (Personnel)<BR><BR>This team is responsible for guiding the strategic direction and operations of SAIL.

View full answer

What does SAIL do?

14-Aug-2026

Steel Authority of India Limited (SAIL) is a leading integrated steel-making company in India, with a market cap of INR 71,210 Cr and reported net sales of 26,246 Cr and net profit of 1,644 Cr for June 2026. Key metrics include a P/E ratio of 14.00 and a dividend yield of 0.92%.

Overview:<BR>Steel Authority of India Limited (SAIL) is the leading steel-making company in India, operating in the Ferrous Metals industry and categorized as a Mid Cap company.<BR><BR>History:<BR>SAIL was incorporated in the year 1973 and has since established itself as a fully integrated iron and steel maker. The latest quarterly results reported are for June 2026, showcasing significant sales and profit figures.<BR><BR>Financial Snapshot:<BR>- Net Sales: 26,246 Cr (Quarterly Results - Jun 2026)<BR>- Net Profit: 1,644 Cr (Quarterly Results - Jun 2026)<BR>- Market Cap: INR 71,210 Cr (Mid Cap)<BR><BR>Key Metrics:<BR>- P/E: 14.00<BR>- Industry P/E: 24<BR>- Dividend Yield: 0.92%<BR>- Debt Equity: 0.52<BR>- Return on Equity: 6.41%<BR>- Price to Book: 1.19<BR><BR>Contact Details:<BR>- Address: Ispat Bhawan, Lodi Road New Delhi New Delhi : 110003<BR>- Tel: 91-11-24367481<BR>- Email: secy.sail@sailex.com<BR>- Website: http://www.sail.co.in

View full answer

Who are the peers of the SAIL?

14-Aug-2026

SAIL's peers include JSW Steel, Tata Steel, Jindal Steel, Lloyds Metals, Jindal Stainless, KIOCL, Sarda Energy, NMDC Steel, and Indian Metals. In terms of management risk, growth, and capital structure, SAIL ranks below average compared to its peers, with a 1-year return of 35.47%, higher than most but lower than Indian Metals at 80.14%.

Peers: The peers of SAIL are JSW Steel, Tata Steel, Jindal Steel, Lloyds Metals, Jindal Stain., KIOCL, Sarda Energy, NMDC Steel, and Indian Metals.<BR><BR>Quality Snapshot: Excellent management risk is observed at JSW Steel, Tata Steel, Jindal Steel, Lloyds Metals, Jindal Stain., and Sarda Energy, while Average management risk is found at SAIL, KIOCL, NMDC Steel, and Indian Metals. Below Average management risk is noted for KIOCL. Growth is Excellent at Lloyds Metals and Jindal Stain., Good at Sarda Energy, while Average growth is seen at Tata Steel and NMDC Steel, and Below Average growth is present at SAIL, JSW Steel, Jindal Steel, KIOCL, and Indian Metals. Capital Structure is Excellent at Lloyds Metals and Indian Metals, Good at Jindal Steel and Sarda Energy, Average at Tata Steel and NMDC Steel, and Below Average at SAIL, JSW Steel, and KIOCL.<BR><BR>Return Snapshot: The peer with the highest 1-year return is Indian Metals at 80.14%, while SAIL has a 1-year return of 35.47%, which is lower than Indian Metals but higher than most peers. The peer with the lowest 1-year return is Sarda Energy at -5.95%. Additionally, Jindal Stain. and Sarda Energy have negative six-month returns.

View full answer

How big is SAIL?

14-Aug-2026

As of 14th August, Steel Authority Of India Ltd. has a market capitalization of 69,186.00 Cr and reported net sales of 111,134.75 Cr and net profit of 4,272.27 Cr over the latest four quarters.

As of 14th August, <BR><BR>Market Cap: Steel Authority Of India Ltd. has a market capitalization of 69,186.00 Cr, classified as a Mid Cap.<BR><BR>Recent Quarterly Performance: The sum of Net Sales for the latest 4 quarters is 111,134.75 Cr, while the sum of Net Profit for the same period is 4,272.27 Cr.<BR><BR>Balance Sheet Snapshot: The reporting period for the latest annual data is March 2025. Shareholder's Funds are valued at 58,905.61 Cr, and Total Assets amount to 1,36,370.94 Cr.

View full answer

Are Steel Authority Of India Ltd. latest results good or bad?

25-Jul-2026

Steel Authority of India Ltd. (SAIL) reported strong Q1 FY27 results, with a net profit of ₹1,644.05 crore, up 120.80% year-on-year, and an operating margin of 15.82%. Despite a slight decline in net sales from the previous quarter, the overall performance indicates a positive turnaround and improved operational efficiency.

Steel Authority of India Ltd. (SAIL) has reported strong results for Q1 FY27, indicating a positive turnaround in its financial performance. The consolidated net profit for the quarter stood at ₹1,644.05 crore, reflecting a remarkable year-on-year increase of 120.80%. This significant growth in profitability is a strong indicator of the company's improved operational efficiency and pricing power.<BR><BR>Additionally, SAIL achieved an operating margin of 15.82%, which is an increase of 514 basis points compared to the same quarter last year. This margin expansion demonstrates the company's effective cost management strategies and ability to navigate raw material cost pressures.<BR><BR>Net sales for the quarter reached ₹26,245.67 crore, showing a modest year-on-year growth of 1.25%. However, it is important to note that there was a sequential decline of 14.82% from the previous quarter, primarily due to seasonal factors and planned maintenance shutdowns.<BR><BR>Overall, the latest results can be characterized as good, particularly due to the substantial improvement in profitability metrics and operating margins, which highlight SAIL's operational strengths and potential for future growth.

View full answer

Should I buy, sell or hold Steel Authority Of India Ltd.?

25-Jul-2026

When is the next results date for Steel Authority Of India Ltd.?

21-Jul-2026

The next results date for Steel Authority Of India Ltd. is 24 July 2026.

The next results date for Steel Authority Of India Ltd. is scheduled for 24 July 2026.

View full answer

Is SAIL technically bullish or bearish?

29-Nov-2025

As of November 28, 2025, the trend is mildly bullish with supportive indicators like a bullish MACD and moving averages, but caution is advised due to mildly bearish signals from the KST and Dow Theory.

As of 28 November 2025, the technical trend has changed from bullish to mildly bullish. The current stance is mildly bullish, supported by a bullish MACD on both weekly and monthly time frames, and a mildly bullish moving average on the daily chart. Bollinger Bands indicate a bullish trend on the weekly and a mildly bullish trend on the monthly. However, the KST shows a mildly bearish signal on the monthly, and Dow Theory indicates a mildly bearish stance on the weekly, which tempers the overall bullish outlook. The RSI shows no signal on both weekly and monthly time frames, and the OBV is neutral on the weekly but bullish on the monthly. Overall, while there are some bullish indicators, the presence of mildly bearish signals suggests caution.

View full answer

Is SAIL overvalued or undervalued?

03-Nov-2025

As of October 31, 2025, SAIL is considered very attractive and undervalued, with a PE ratio of 20.08, significantly lower than its peers like JSW Steel and Tata Steel, and a year-to-date return of 21.26%, outperforming the Sensex's 7.42%.

As of 31 October 2025, SAIL's valuation grade has moved from attractive to very attractive, indicating a significant improvement in its perceived value. The company is currently considered undervalued, particularly when examining key financial ratios such as a PE ratio of 20.08, a Price to Book Value of 0.10, and an EV to EBITDA of 23.17. These figures suggest that SAIL is trading at a lower valuation compared to its peers.<BR><BR>In comparison to its industry counterparts, SAIL's PE ratio is notably lower than JSW Steel's 48.13 and Tata Steel's 47.06, both of which are categorized as expensive. Additionally, SAIL's PEG ratio stands at 0.00, indicating strong growth potential relative to its price. The company's recent stock performance has also outpaced the Sensex, with a year-to-date return of 21.26% compared to the Sensex's 7.42%, reinforcing the narrative of SAIL being undervalued in the current market.

View full answer

How has been the historical performance of SAIL?

29-Oct-2025

SAIL's historical performance shows fluctuations, with net sales decreasing to 1,02,479.06 Cr in Mar'25 from 1,05,378.33 Cr in Mar'24, alongside declines in profitability metrics such as profit after tax and earnings per share. However, cash flow from operating activities improved significantly to 9,914.00 Cr in Mar'25, indicating better cash generation despite overall profit declines.

Answer:<BR>The historical performance of SAIL shows fluctuations in key financial metrics over the years, with net sales reaching 1,02,479.06 Cr in Mar'25, a decrease from 1,05,378.33 Cr in Mar'24, but an increase from 1,04,447.72 Cr in Mar'23. The total operating income mirrored this trend, with a similar decrease in Mar'25. Raw material costs significantly decreased to 49,051.46 Cr in Mar'25 from 57,709.28 Cr in Mar'24, contributing to a total expenditure of 91,832.85 Cr in Mar'25, down from 94,229.04 Cr in Mar'24. Operating profit (PBDIT) also saw a decline to 11,521.24 Cr in Mar'25 from 12,216.25 Cr in Mar'24, while profit before tax decreased to 2,764.75 Cr in Mar'25 from 3,623.18 Cr in Mar'24. Profit after tax followed suit, dropping to 1,885.02 Cr in Mar'25 from 2,628.04 Cr in Mar'24. The earnings per share (EPS) decreased to 5.74 in Mar'25 from 7.42 in Mar'24, reflecting a similar downward trend in profitability. On the balance sheet, total liabilities decreased to 1,36,370.94 Cr in Mar'25 from 1,40,708.58 Cr in Mar'24, while total assets also fell to 1,36,370.94 Cr in Mar'25 from 1,40,708.58 Cr in Mar'24. Cash flow from operating activities improved to 9,914.00 Cr in Mar'25 from 2,910.00 Cr in Mar'24, indicating a positive shift in cash generation despite the overall decline in profits.<BR><BR>Breakdown:<BR>SAIL's financial performance over the years reveals a pattern of volatility, particularly in revenue and profitability metrics. In Mar'25, net sales were recorded at 1,02,479.06 Cr, down from the previous year's 1,05,378.33 Cr, while total operating income followed suit. The reduction in raw material costs to 49,051.46 Cr in Mar'25 from 57,709.28 Cr in Mar'24 contributed to a decrease in total expenditure. Operating profit (PBDIT) also declined, indicating challenges in maintaining profitability, with profit before tax and profit after tax both showing decreases in Mar'25. The earnings per share reflected this trend, dropping to 5.74. On the balance sheet, total liabilities and total assets both decreased, suggesting a tightening financial position. However, cash flow from operating activities saw a significant improvement, indicating better cash generation capabilities despite the overall decline in profitability metrics.

View full answer

Who are the top shareholders of the SAIL?

17-Jul-2025

The top shareholders of SAIL include the President of India with 65.0%, LICI ASM Non Par at 9.99%, mutual funds at 4.06%, foreign institutional investors at 3.2%, and individual investors holding 14.27%.

The top shareholders of SAIL are primarily the promoters, with the President of India holding the largest stake at 65.0%. In terms of public shareholders, LICI ASM Non Par holds 9.99%. Additionally, mutual funds collectively hold 4.06% through 40 schemes, while foreign institutional investors (FIIs) account for 3.2% with 143 FIIs involved. Individual investors also have a notable presence, holding 14.27% of the shares.

View full answer

Has SAIL declared dividend?

06-Jun-2025

Yes, Steel Authority of India Ltd. has declared a 10% dividend, amounting to ₹1 per share, with an ex-date of September 19, 2024. The company has shown significant total returns over various periods, particularly a 348.54% total return over the last 5 years.

Steel Authority Of India Ltd. has declared a 10% dividend.<BR><BR>Dividend Details:<BR>- Percentage announced: 10%<BR>- Amount per share: 1<BR>- Ex-date: 19 Sep 24<BR><BR>Dividend Yield: 0.75%.<BR><BR>Total Returns by Period:<BR>In the last 6 months, the price return was 8.88%, with a dividend return of 0%, resulting in a total return of 8.88%.<BR><BR>Over the past year, the price return was -8.2%, with a dividend return of 0.66%, leading to a total return of -7.54%.<BR><BR>In the last 2 years, the price return was 62.02%, with a dividend return of 2.91%, resulting in a total return of 64.93%.<BR><BR>For the 3-year period, the price return was 78.26%, with a dividend return of 7.07%, leading to a total return of 85.33%.<BR><BR>Over the past 4 years, the price return was 9.68%, with a dividend return of 9.76%, resulting in a total return of 19.44%.<BR><BR>In the last 5 years, the price return was 303.74%, with a dividend return of 44.80%, leading to a total return of 348.54%.<BR><BR>Overall, SAIL's dividend declaration indicates a commitment to returning value to shareholders, and the total returns over various periods show significant growth, particularly over the longer term. The company has experienced fluctuations in price returns, but the overall trend suggests a positive trajectory in shareholder returns.

View full answer
iScoreScore
Click here to find our call on this stock
Strong Sell
Sell
Hold
Buy
Strong Buy

Dashboard

1

With a growth in Net Profit of 94.98%, the company declared Very Positive results in Jun 26

  • The company has declared positive results for the last 2 consecutive quarters
  • PBT LESS OI(Q) At Rs 2,125.15 cr has Grown at 98.6% (vs previous 4Q average)
  • PAT(Q) At Rs 1,752.32 cr has Grown at 81.1% (vs previous 4Q average)
  • ROCE(HY) Highest at 7.94%
2

With ROCE of 6.6, it has a Attractive valuation with a 1.1 Enterprise value to Capital Employed

3

High Institutional Holdings at 23.95%

stock-summaryMojo Parameters

Mojo Parameters

Loading Valuation Snapshot...

Stock DNA

stock-summary
Industry

Ferrous Metals

stock-summary
Market cap

INR 72,016 Cr (Mid Cap)

stock-summary
P/E

15.00

stock-summary
Industry P/E

24

stock-summary
Dividend Yield

0.92%

stock-summary
Debt Equity

0.52

stock-summary
Return on Equity

6.41%

stock-summary
Price to Book

1.20

Revenue and Profits:
Net Sales:
26,246 Cr
(Quarterly Results - Jun 2026)
Net Profit:
1,644 Cr
stock-summaryTotal Returns
Total Returns (Price + Dividend) stock-summary
Dividend Yield (0.92%)
TimePeriod
Price Return
Dividend Return
Total Return
3 Months
-11.23%
0%
-11.23%
6 Months
9.79%
0%
9.79%
1 Year
41.52%
1.34%
42.86%
2 Years
29.15%
1.95%
31.1%
3 Years
102.66%
4.13%
106.79%
4 Years
113.27%
4.92%
118.19%
5 Years
46.39%
12.21%
58.6%

Latest dividend: 1.6 per share ex-dividend date: Sep-09-2025

Risk Adjusted Returns v/s stock-summary
Returns Beta
Icon
Beta has not been calculated since enough price history is not available
stock-summaryNews & Corporate Actions

Announcements stock-summary

Rumour verification - Regulation 30(11)

10-Aug-2026 | Source : BSE

Rumour Clarification from SAIL

Clarification sought from Steel Authority of India Ltd

10-Aug-2026 | Source : BSE

The Exchange has sought clarification from Steel Authority of India Ltd on August 10 2026 with reference to news appeared in https://www.moneycontrol.com/ dated August 10 2026 quoting "Steel Authority of India eyes 5% FPO in FY27 to raise funds for capex push. "

The reply is awaited.

Announcement under Regulation 30 (LODR)-Earnings Call Transcript

01-Aug-2026 | Source : BSE

Analyst Meet - Transcript

Corporate Actions stock-summary

stock-summary
BOARD MEETING

No Upcoming Board Meetings

stock-summary
DIVIDEND

Steel Authority Of India Ltd. has declared 16% dividend, ex-date: 09 Sep 25

stock-summary
SPLITS

No Splits history available

stock-summary
BONUS

No Bonus history available

stock-summary
RIGHTS

No Rights history available

stock-summaryKey Factors

Quality key factors stock-summary

Factor
Value
Sales Growth (5y)
6.61%
EBIT Growth (5y)
-14.09%
EBIT to Interest (avg)
3.43
Debt to EBITDA (avg)
2.78
Net Debt to Equity (avg)
0.52
Sales to Capital Employed (avg)
1.19
Tax Ratio
25.37%
Dividend Payout Ratio
27.86%
Pledged Shares
0
Institutional Holding
23.95%
ROCE (avg)
9.72%
ROE (avg)
8.90%

Valuation key factors

Factor
Value
P/E Ratio
15
Industry P/E
24
Price to Book Value
1.20
EV to EBIT
14.21
EV to EBITDA
7.73
EV to Capital Employed
1.13
EV to Sales
0.93
PEG Ratio
0.25
Dividend Yield
0.92%
ROCE (Latest)
6.57%
ROE (Latest)
6.41%

Technicals key factors

Indicator
Weekly
Monthly
MACD
Mildly Bearish
Bullish
RSI
No Signal
No Signal
Bollinger Bands
Mildly Bearish
Bullish
Moving Averages
Bullish (Daily)
KST
Mildly Bearish
Bullish
Dow Theory
No Trend
Mildly Bearish
OBV
Mildly Bullish
Mildly Bearish
stock-summary Technical Indicator Scale: Bearish, Mildly Bearish, Sideways, Mildly Bullish, Bullish  Turned 
stock-summaryShareholding
Shareholding Snapshot : Jun 2026stock-summary
Shareholding Compare (%holding) stock-summary
Majority shareholders

Promoters

Pledged Promoter Holdings

None

Mutual Funds

Held by 44 Schemes (8.74%)

FIIs

Held by 307 FIIs (7.09%)

Promoter with highest holding

President Of India (65.0%)

Highest Public shareholder

Lici Asm Non Par (5.88%)

Individual Investors Holdings

8.91%

stock-summaryFinancial
[
  {
    "link": "quarterly",
    "btn_text": "All Quarterly Results",
    "header": "Quarterly Results Snapshot (Consolidated) - Jun'26 - QoQ",
    "rhs": [
      {
        "prefix": "Net Sales ",
        "suffix": "QoQ Growth in quarter ended Jun 2026 is -14.82% vs 12.58% in Mar 2026",
        "dir": -1
      },
      {
        "prefix": "Consolidated Net Profit ",
        "suffix": "QoQ Growth in quarter ended Jun 2026 is -10.43% vs 390.73% in Mar 2026",
        "dir": -1
      }
    ],
    "table": {
      "header": [
        "Jun'26",
        "Mar'26",
        "Change(%)"
      ],
      "body": [
        {
          "field": "Net Sales",
          "val1": "26,245.67",
          "val2": "30,813.49",
          "chgp": "-14.82%",
          "chgp_class": "negative"
        },
        {
          "field": "Operating Profit (PBDIT) excl Other Income",
          "val1": "4,152.71",
          "val2": "4,408.73",
          "chgp": "-5.81%",
          "chgp_class": "negative"
        },
        {
          "field": "Interest",
          "val1": "493.02",
          "val2": "532.04",
          "chgp": "-7.33%",
          "chgp_class": "positive"
        },
        {
          "field": "Exceptional Items",
          "val1": "-144.01",
          "val2": "-329.78",
          "chgp": "56.33%",
          "chgp_class": "positive"
        },
        {
          "field": "Consolidate Net Profit",
          "val1": "1,644.05",
          "val2": "1,835.47",
          "chgp": "-10.43%",
          "chgp_class": "negative"
        },
        {
          "field": "Operating Profit Margin (Excl OI)",
          "val1": "15.82%",
          "val2": "14.31%",
          "chgp": "1.51%",
          "chgp_class": "positive"
        }
      ]
    }
  },
  {
    "link": "half-yearly",
    "btn_text": "All Half Yearly Results",
    "header": "Half Yearly Results Snapshot (Consolidated) - Sep'25",
    "rhs": [
      {
        "prefix": "Net Sales ",
        "suffix": " Growth in half year ended Sep 2025 is 8.12% vs -9.98% in Sep 2024",
        "dir": 1
      },
      {
        "prefix": "Consolidated Net Profit ",
        "suffix": " Growth in half year ended Sep 2025 is 18.83% vs -35.51% in Sep 2024",
        "dir": 1
      }
    ],
    "table": {
      "header": [
        "Sep'25",
        "Sep'24",
        "Change(%)"
      ],
      "body": [
        {
          "field": "Net Sales",
          "val1": "52,625.93",
          "val2": "48,673.01",
          "chgp": "8.12%",
          "chgp_class": "positive"
        },
        {
          "field": "Operating Profit (PBDIT) excl Other Income",
          "val1": "5,296.95",
          "val2": "5,132.68",
          "chgp": "3.20%",
          "chgp_class": "positive"
        },
        {
          "field": "Interest",
          "val1": "1,078.88",
          "val2": "1,449.10",
          "chgp": "-25.55%",
          "chgp_class": "positive"
        },
        {
          "field": "Exceptional Items",
          "val1": "-338.44",
          "val2": "-311.76",
          "chgp": "-8.56%",
          "chgp_class": "negative"
        },
        {
          "field": "Consolidate Net Profit",
          "val1": "1,163.30",
          "val2": "978.93",
          "chgp": "18.83%",
          "chgp_class": "positive"
        },
        {
          "field": "Operating Profit Margin (Excl OI)",
          "val1": "10.07%",
          "val2": "10.55%",
          "chgp": "-0.48%",
          "chgp_class": "negative"
        }
      ]
    }
  },
  {
    "link": "nine-monthly",
    "btn_text": "All Nine Monthly Results",
    "header": "Nine Monthly Results Snapshot (Consolidated) - Dec'25",
    "rhs": [
      {
        "prefix": "Net Sales ",
        "suffix": "YoY Growth in nine months ended Dec 2025 is 9.34% vs -5.50% in Dec 2024",
        "dir": 1
      },
      {
        "prefix": "Consolidated Net Profit ",
        "suffix": "YoY Growth in nine months ended Dec 2025 is 37.16% vs -42.26% in Dec 2024",
        "dir": 1
      }
    ],
    "table": {
      "header": [
        "Dec'25",
        "Dec'24",
        "Change(%)"
      ],
      "body": [
        {
          "field": "Net Sales",
          "val1": "79,997.35",
          "val2": "73,162.92",
          "chgp": "9.34%",
          "chgp_class": "positive"
        },
        {
          "field": "Operating Profit (PBDIT) excl Other Income",
          "val1": "7,591.26",
          "val2": "7,162.35",
          "chgp": "5.99%",
          "chgp_class": "positive"
        },
        {
          "field": "Interest",
          "val1": "1,626.11",
          "val2": "2,128.73",
          "chgp": "-23.61%",
          "chgp_class": "positive"
        },
        {
          "field": "Exceptional Items",
          "val1": "-338.44",
          "val2": "-283.23",
          "chgp": "-19.49%",
          "chgp_class": "negative"
        },
        {
          "field": "Consolidate Net Profit",
          "val1": "1,537.33",
          "val2": "1,120.82",
          "chgp": "37.16%",
          "chgp_class": "positive"
        },
        {
          "field": "Operating Profit Margin (Excl OI)",
          "val1": "9.49%",
          "val2": "9.79%",
          "chgp": "-0.30%",
          "chgp_class": "negative"
        }
      ]
    }
  },
  {
    "link": "annual",
    "btn_text": "All Annual Results",
    "header": "Annual Results Snapshot (Consolidated) - Mar'26",
    "rhs": [
      {
        "prefix": "Net Sales ",
        "suffix": "YoY Growth in year ended Mar 2026 is 8.13% vs -2.75% in Mar 2025",
        "dir": 1
      },
      {
        "prefix": "Consolidated Net Profit ",
        "suffix": "YoY Growth in year ended Mar 2026 is 42.20% vs -22.66% in Mar 2025",
        "dir": 1
      }
    ],
    "table": {
      "header": [
        "Mar'26",
        "Mar'25",
        "Change(%)"
      ],
      "body": [
        {
          "field": "Net Sales",
          "val1": "1,10,810.84",
          "val2": "1,02,479.06",
          "chgp": "8.13%",
          "chgp_class": "positive"
        },
        {
          "field": "Operating Profit (PBDIT) excl Other Income",
          "val1": "11,999.99",
          "val2": "10,646.21",
          "chgp": "12.72%",
          "chgp_class": "positive"
        },
        {
          "field": "Interest",
          "val1": "2,158.15",
          "val2": "2,793.17",
          "chgp": "-22.73%",
          "chgp_class": "positive"
        },
        {
          "field": "Exceptional Items",
          "val1": "-668.22",
          "val2": "-312.64",
          "chgp": "-113.73%",
          "chgp_class": "negative"
        },
        {
          "field": "Consolidate Net Profit",
          "val1": "3,372.80",
          "val2": "2,371.82",
          "chgp": "42.20%",
          "chgp_class": "positive"
        },
        {
          "field": "Operating Profit Margin (Excl OI)",
          "val1": "10.83%",
          "val2": "10.39%",
          "chgp": "0.44%",
          "chgp_class": "positive"
        }
      ]
    }
  }
]

Quarterly Results Snapshot (Consolidated) - Jun'26 - QoQstock-summary

Jun'26
Mar'26
Change(%)
Net Sales
26,245.67
30,813.49
-14.82%
Operating Profit (PBDIT) excl Other Income
4,152.71
4,408.73
-5.81%
Interest
493.02
532.04
-7.33%
Exceptional Items
-144.01
-329.78
56.33%
Consolidate Net Profit
1,644.05
1,835.47
-10.43%
Operating Profit Margin (Excl OI)
15.82%
14.31%
1.51%
Values in Rs Cr.
Direction Arrows
Net Sales

QoQ Growth in quarter ended Jun 2026 is -14.82% vs 12.58% in Mar 2026

Direction Arrows
Consolidated Net Profit

QoQ Growth in quarter ended Jun 2026 is -10.43% vs 390.73% in Mar 2026

Half Yearly Results Snapshot (Consolidated) - Sep'25stock-summary

Sep'25
Sep'24
Change(%)
Net Sales
52,625.93
48,673.01
8.12%
Operating Profit (PBDIT) excl Other Income
5,296.95
5,132.68
3.20%
Interest
1,078.88
1,449.10
-25.55%
Exceptional Items
-338.44
-311.76
-8.56%
Consolidate Net Profit
1,163.30
978.93
18.83%
Operating Profit Margin (Excl OI)
10.07%
10.55%
-0.48%
Values in Rs Cr.
Direction Arrows
Net Sales

Growth in half year ended Sep 2025 is 8.12% vs -9.98% in Sep 2024

Direction Arrows
Consolidated Net Profit

Growth in half year ended Sep 2025 is 18.83% vs -35.51% in Sep 2024

Nine Monthly Results Snapshot (Consolidated) - Dec'25stock-summary

Dec'25
Dec'24
Change(%)
Net Sales
79,997.35
73,162.92
9.34%
Operating Profit (PBDIT) excl Other Income
7,591.26
7,162.35
5.99%
Interest
1,626.11
2,128.73
-23.61%
Exceptional Items
-338.44
-283.23
-19.49%
Consolidate Net Profit
1,537.33
1,120.82
37.16%
Operating Profit Margin (Excl OI)
9.49%
9.79%
-0.30%
Values in Rs Cr.
Direction Arrows
Net Sales

YoY Growth in nine months ended Dec 2025 is 9.34% vs -5.50% in Dec 2024

Direction Arrows
Consolidated Net Profit

YoY Growth in nine months ended Dec 2025 is 37.16% vs -42.26% in Dec 2024

Annual Results Snapshot (Consolidated) - Mar'26stock-summary

Mar'26
Mar'25
Change(%)
Net Sales
1,10,810.84
1,02,479.06
8.13%
Operating Profit (PBDIT) excl Other Income
11,999.99
10,646.21
12.72%
Interest
2,158.15
2,793.17
-22.73%
Exceptional Items
-668.22
-312.64
-113.73%
Consolidate Net Profit
3,372.80
2,371.82
42.20%
Operating Profit Margin (Excl OI)
10.83%
10.39%
0.44%
Values in Rs Cr.
Direction Arrows
Net Sales

YoY Growth in year ended Mar 2026 is 8.13% vs -2.75% in Mar 2025

Direction Arrows
Consolidated Net Profit

YoY Growth in year ended Mar 2026 is 42.20% vs -22.66% in Mar 2025

stock-summaryCompany CV
About Steel Authority Of India Ltd. stock-summary
stock-summary
Steel Authority Of India Ltd.
Mid Cap
Ferrous Metals
Steel Authority of India Limited (SAIL) is the leading steel-making company in India. The company is a fully integrated iron and steel maker, producing both basic and special steels for domestic construction, engineering, power, railway, automotive and defence industries and for sale in export markets. They are also among the seven Maharatnas of the country's Central Public Sector Enterprises.
Company Coordinates stock-summary
Company Details
Ispat Bhawan, Lodi Road New Delhi New Delhi : 110003
stock-summary
Tel: 91-11-24367481
stock-summary
secy.sail@sailex.com
Registrar Details
MCS Ltd , F-65, , Okhla Industrial Area, Phase - I, New Delhi