
Compare Sainik Finance with Similar Stocks
Stock DNA
Cement & Cement Products
INR 43 Cr (Micro Cap)
10.00
27
0.00%
2.17
8.66%
0.88
Total Returns (Price + Dividend) 
Sainik Finance for the last several years.
Risk Adjusted Returns v/s
Returns Beta

News
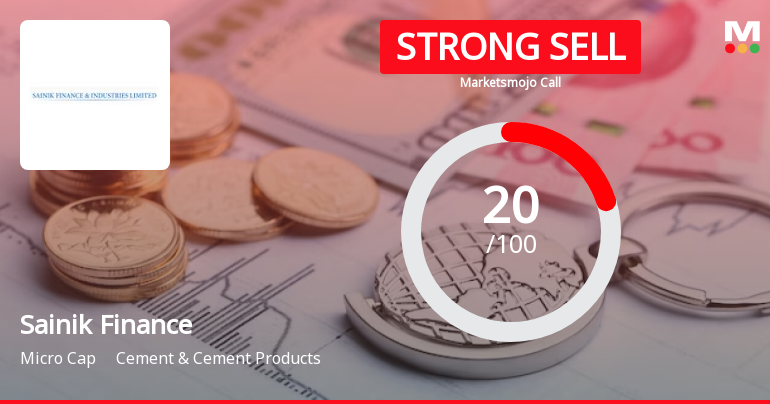
Sainik Finance & Industries Ltd is Rated Strong Sell
Sainik Finance & Industries Ltd is rated Strong Sell by MarketsMOJO. This rating was last updated on 29 May 2026, reflecting a shift from the previous 'Sell' grade. However, the analysis and financial metrics discussed below represent the stock's current position as of 01 July 2026, providing investors with the latest insights into the company’s performance and outlook.
Read full news article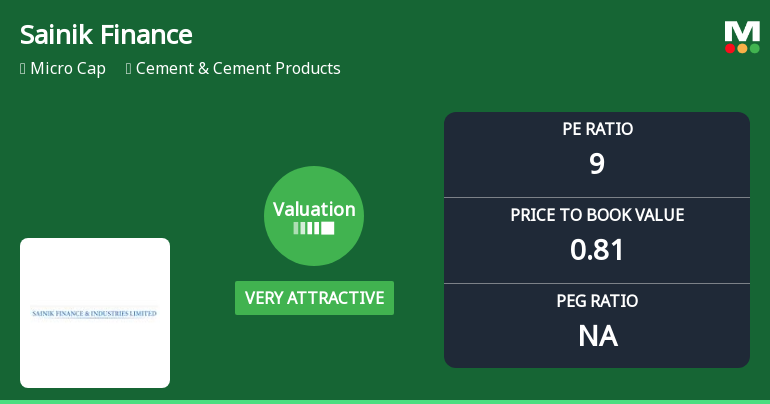
Sainik Finance & Industries Ltd Valuation Shifts Signal Renewed Price Attractiveness
Sainik Finance & Industries Ltd, a micro-cap player in the Cement & Cement Products sector, has witnessed a notable shift in its valuation parameters, moving from an attractive to a very attractive rating. Despite recent price declines, the company’s price-to-earnings (P/E) and price-to-book value (P/BV) ratios now present compelling valuation metrics relative to both historical levels and peer averages, prompting a reassessment of its price attractiveness amid a challenging market backdrop.
Read full news article
Sainik Finance & Industries Ltd is Rated Strong Sell
Sainik Finance & Industries Ltd is rated Strong Sell by MarketsMOJO, with this rating last updated on 29 May 2026. However, the analysis and financial metrics presented here reflect the company’s current position as of 18 June 2026, providing investors with an up-to-date view of the stock’s fundamentals, returns, and technical outlook.
Read full news article Announcements
Closure of Trading Window
25-Jun-2026 | Source : BSEIntimation of closure of trading window of the Company for the quarter ended 30th June 2026
Announcement under Regulation 30 (LODR)-Newspaper Publication
17-Jun-2026 | Source : BSESubmission of Newspaper Advertisement in which information regarding re-opening of special window for re-lodgment of transfer requests of phyiscal shares are given.
Announcement under Regulation 30 (LODR)-Newspaper Publication
29-May-2026 | Source : BSESubmission of copiesof newspaper in which audited financial results of the Company for the quarter /year ended 31.03.2026 is published
Corporate Actions

No Upcoming Board Meetings

No Dividend history available

No Splits history available

No Bonus history available

No Rights history available
Quality key factors
Valuation key factors
Technicals key factors
 Technical Indicator Scale: Bearish, Mildly Bearish, Sideways, Mildly Bullish, Bullish Turned
 Shareholding Snapshot : Mar 2026
Shareholding Compare (%holding)
Promoters
None
Held by 0 Schemes
Held by 0 FIIs
Kuldeep Singh Solanki (23.01%)
Manak Vanijya Private Limited (3.14%)
21.95%
Quarterly Results Snapshot (Standalone) - Mar'26 - YoY

YoY Growth in quarter ended Mar 2026 is -9.51% vs 42.55% in Mar 2025
YoY Growth in quarter ended Mar 2026 is -52.81% vs 444.90% in Mar 2025
Half Yearly Results Snapshot (Standalone) - Sep'25

Growth in half year ended Sep 2025 is 2.94% vs -4.71% in Sep 2024
Growth in half year ended Sep 2025 is -20.00% vs 9.95% in Sep 2024
Nine Monthly Results Snapshot (Standalone) - Dec'25
YoY Growth in nine months ended Dec 2025 is 6.13% vs -1.21% in Dec 2024
YoY Growth in nine months ended Dec 2025 is -16.57% vs 131.79% in Dec 2024
Annual Results Snapshot (Standalone) - Mar'26
YoY Growth in year ended Mar 2026 is 1.26% vs 9.31% in Mar 2025
YoY Growth in year ended Mar 2026 is -32.52% vs 209.00% in Mar 2025
About Sainik Finance & Industries Ltd

Company Coordinates


