
Compare Saint-Gob. Sekur with Similar Stocks
Dashboard
The company is Net-Debt Free
Healthy long term growth as Operating profit has grown by an annual rate 34.94%
The company has declared Positive results for the last 4 consecutive quarters
With ROE of 18.8, it has a Very Expensive valuation with a 4.7 Price to Book Value
Despite the size of the company, domestic mutual funds hold only 0.01% of the company
Market Beating Performance
Stock DNA
Auto Components & Equipments
INR 1,139 Cr (Micro Cap)
25.00
36
1.63%
-0.83
18.83%
4.60
Total Returns (Price + Dividend) 
Latest dividend: 2 per share ex-dividend date: Jul-15-2025
Risk Adjusted Returns v/s
Returns Beta

News
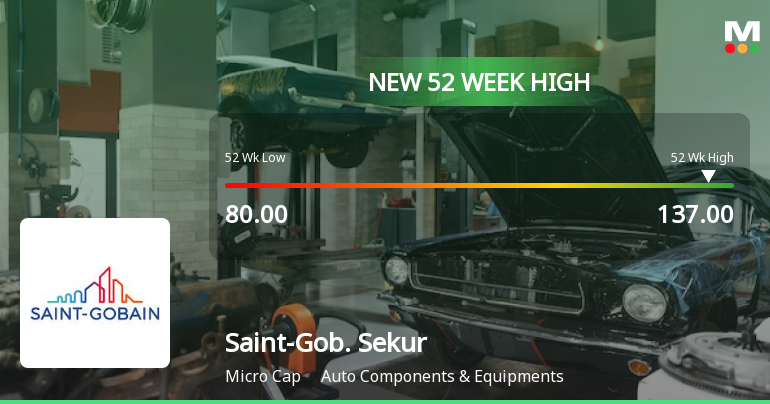
Broad-Based Technical Strength Lifts Saint-Gobain Sekurit India Ltd to 52-Week High of Rs 136.8
Surging past its previous peak, Saint-Gobain Sekurit India Ltd touched a fresh 52-week high of Rs 136.8 on 8 Jun 2026, marking a significant milestone in its price momentum. This rally has been fuelled by a confluence of strong technical signals and sustained buying interest, setting the stock apart in a market environment where the broader indices have struggled.
Read full news article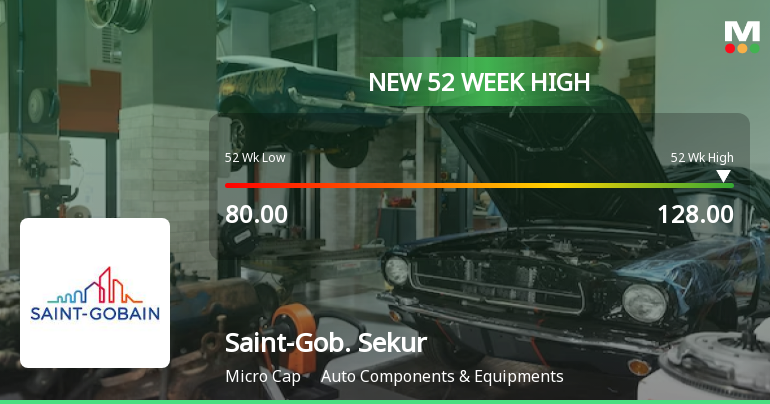
Broad-Based Technical Strength Lifts Saint-Gobain Sekurit India Ltd to 52-Week High of Rs 128
With a decisive break above Rs 128 on 4 Jun 2026, Saint-Gobain Sekurit India Ltd has reached a fresh 52-week high, marking a notable milestone in its price momentum. This advance comes amid a sustained four-day rally that has delivered over 10.8% returns, outpacing its sector by 3.65% on the day.
Read full news article
Saint-Gobain Sekurit India Ltd Upgraded to Hold on Technical and Financial Improvements
Saint-Gobain Sekurit India Ltd has seen its investment rating upgraded from Sell to Hold, reflecting a marked improvement in technical indicators and sustained financial performance. The company’s micro-cap status, combined with a robust quarterly earnings report and positive long-term returns, has contributed to this reassessment by MarketsMOJO. This article analyses the four key parameters—Quality, Valuation, Financial Trend, and Technicals—that triggered the upgrade and what it means for investors.
Read full news article Announcements
Announcement under Regulation 30 (LODR)-Newspaper Publication
01-Jun-2026 | Source : BSEPlease find attached newspaper advertisements regarding second 100-day saksham niveshak campaign and special window for transfer and dematerialisation of physical shares
Execution Of PPA And SSA With Murli Solar Energy Private Limited And Sunsure Energy Private Limited For Sourcing Of Renewable Energy
25-May-2026 | Source : BSEPlease find attached intimation regarding execution of Power Purchase Agreement and Share Subscription Agreement with Murli Solar Energy Private Limited and Sunsure Energy Private Limited for sourcing of renewable energy.
Compliances-Reg.24(A)-Annual Secretarial Compliance
18-May-2026 | Source : BSEPlease find attached the Secretarial Compliance Report for the year ended March 31 2026
Corporate Actions

No Upcoming Board Meetings

Saint-Gobain Sekurit India Ltd has declared 25% dividend, ex-date: 15 Jul 26

No Splits history available

No Bonus history available

No Rights history available
Quality key factors
Valuation key factors
Technicals key factors
 Technical Indicator Scale: Bearish, Mildly Bearish, Sideways, Mildly Bullish, Bullish Turned
 Shareholding Snapshot : Mar 2026
Shareholding Compare (%holding)
Promoters
None
Held by 1 Schemes (0.0%)
Held by 1 FIIs (0.0%)
Saint-gobain Sekurit France (48.26%)
None
21.78%
Quarterly Results Snapshot (Standalone) - Mar'26 - QoQ

QoQ Growth in quarter ended Mar 2026 is 7.13% vs 2.28% in Dec 2025
QoQ Growth in quarter ended Mar 2026 is 16.95% vs 4.09% in Dec 2025
Half Yearly Results Snapshot (Standalone) - Sep'25
Growth in half year ended Sep 2025 is 13.62% vs -1.97% in Sep 2024
Growth in half year ended Sep 2025 is 35.18% vs 1.15% in Sep 2024
Nine Monthly Results Snapshot (Standalone) - Dec'25
YoY Growth in nine months ended Dec 2025 is 14.18% vs -0.92% in Dec 2024
YoY Growth in nine months ended Dec 2025 is 25.83% vs 8.57% in Dec 2024
Annual Results Snapshot (Standalone) - Mar'26
YoY Growth in year ended Mar 2026 is 17.29% vs 2.06% in Mar 2025
YoY Growth in year ended Mar 2026 is 27.29% vs 15.21% in Mar 2025
About Saint-Gobain Sekurit India Ltd

Company Coordinates


