
Compare Saj Hotels with Similar Stocks
Dashboard
Weak Long Term Fundamental Strength with an average Return on Equity (ROE) of 2.90%
- Poor long term growth as Net Sales has grown by an annual rate of 8.80% and Operating profit at 4.90% over the last 5 years
Flat results in Mar 26
Below par performance in long term as well as near term
Total Returns (Price + Dividend) 
Saj Hotels for the last several years.
Risk Adjusted Returns v/s
Returns Beta

News
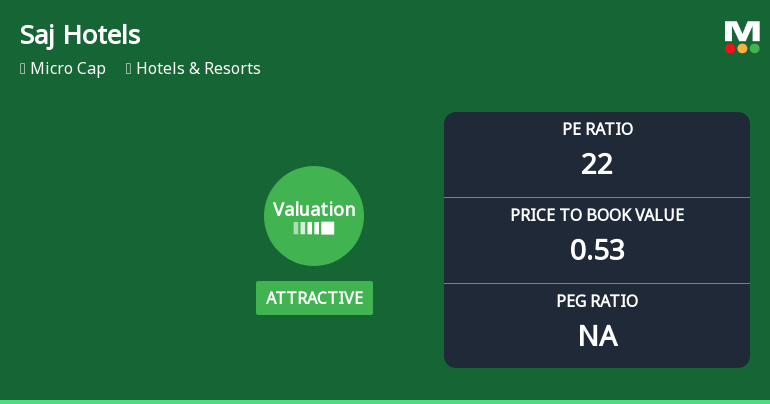
Saj Hotels Ltd Valuation Shifts Signal Renewed Price Attractiveness Amid Sector Challenges
Saj Hotels Ltd has witnessed a notable shift in its valuation parameters, moving from a fair to an attractive rating, driven primarily by its current price-to-earnings (P/E) and price-to-book value (P/BV) ratios. Despite ongoing sector headwinds and a challenging financial performance, the stock’s valuation now presents a compelling case for investors seeking value within the micro-cap Hotels & Resorts segment.
Read full news article
Saj Hotels Ltd Valuation Shifts to Attractive Amid Market Headwinds
Saj Hotels Ltd has witnessed a notable shift in its valuation parameters, moving from a fair to an attractive rating, despite ongoing sector headwinds and a challenging price performance. This recalibration in price-to-earnings and price-to-book value ratios offers investors a fresh perspective on the micro-cap hotel and resorts player, especially when contrasted with its peers and historical benchmarks.
Read full news article
Saj Hotels Ltd is Rated Strong Sell
Saj Hotels Ltd is rated Strong Sell by MarketsMOJO, with this rating last updated on 04 May 2026. However, the analysis and financial metrics discussed here reflect the company’s current position as of 26 May 2026, providing investors with the latest insights into the stock’s performance and outlook.
Read full news article Announcements
Corporate Actions

No Upcoming Board Meetings

No Dividend history available

No Splits history available

No Bonus history available

No Rights history available
Quality key factors
Valuation key factors
Technicals key factors
 Technical Indicator Scale: Bearish, Mildly Bearish, Sideways, Mildly Bullish, Bullish Turned
 Shareholding Snapshot : Mar 2026
Shareholding Compare (%holding)
Promoters
None
Held by 0 Schemes
Held by 1 FIIs (0.04%)
Rahul Maganlal Timbadia (58.07%)
Reina R Jaisinghani (6.2%)
30.03%
Quarterly Results Snapshot (Consolidated) - Mar'26 - QoQ

QoQ Growth in quarter ended Mar 2026 is 1.09% vs 16.46% in Dec 2025
QoQ Growth in quarter ended Mar 2026 is -16.67% vs 21.43% in Dec 2025
Half Yearly Results Snapshot (Consolidated) - Mar'26

Growth in half year ended Mar 2026 is 21.23% vs -20.02% in Sep 2025
Growth in half year ended Mar 2026 is 107.78% vs -56.94% in Sep 2025
Nine Monthly Results Snapshot (Consolidated) - Dec'25
YoY Growth in nine months ended Dec 2025 is 1.24% vs 1.94% in Dec 2024
YoY Growth in nine months ended Dec 2025 is -36.21% vs 14.89% in Dec 2024
Annual Results Snapshot (Consolidated) - Mar'26
YoY Growth in year ended Mar 2026 is 0.42% vs 17.88% in Mar 2025
YoY Growth in year ended Mar 2026 is -29.34% vs -20.49% in Mar 2025
About Saj Hotels Ltd

Company Coordinates


