
Compare Sakuma Exports with Similar Stocks
Stock DNA
Trading & Distributors
INR 296 Cr (Micro Cap)
31.00
21
0.00%
-0.19
1.27%
0.40
Total Returns (Price + Dividend) 
Latest dividend: 0.05000000000000001 per share ex-dividend date: Jul-16-2024
Risk Adjusted Returns v/s
Returns Beta

News

Sakuma Exports Ltd is Rated Sell
Sakuma Exports Ltd is rated 'Sell' by MarketsMOJO, with this rating last updated on 01 June 2026. However, the analysis and financial metrics discussed here reflect the stock’s current position as of 11 June 2026, providing investors with the latest insights into its performance and outlook.
Read full news articleAre Sakuma Exports Ltd latest results good or bad?
Sakuma Exports Ltd's latest financial results for the quarter ended March 2026 present a complex picture of operational performance. The company reported a significant sequential increase in net sales, which rose to ₹714.68 crores, marking a 96.63% growth compared to the previous quarter's ₹363.46 crores. This surge in revenue is notable as it represents the highest quarterly figure in recent history, although it still reflects a slight year-on-year decline of 2.32% from ₹731.69 crores in the same quarter of the previous year. The net profit for the quarter also saw a remarkable increase, reaching ₹6.52 crores, a substantial rise of 968.85% from the prior quarter. This improvement in profitability was supported by a positive shift in operational efficiency, as indicated by the expansion of the profit after tax (PAT) margin to 0.91% from 0.17% in the previous quarter. However, this margin still lags behind ...
Read full news article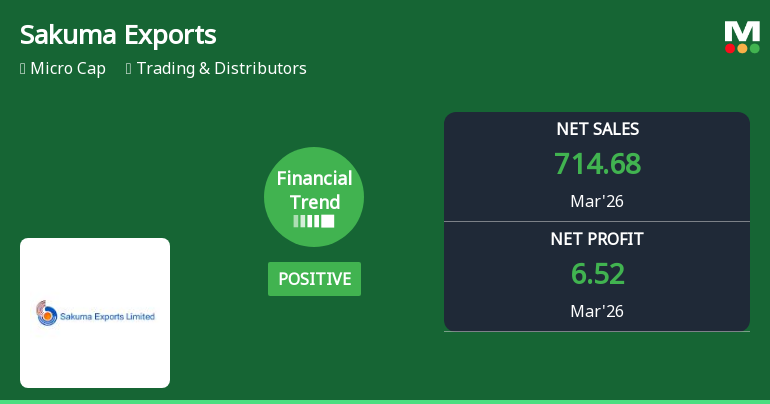
Sakuma Exports Ltd Reports Strong Quarterly Turnaround with Robust Revenue Growth
Sakuma Exports Ltd has demonstrated a marked turnaround in its financial performance for the quarter ended March 2026, with net sales surging 65.7% compared to the previous four-quarter average. The company’s financial trend score has improved significantly from -19 to 12 over the past three months, signalling a positive shift in operational momentum and profitability metrics.
Read full news article Announcements
Announcement under Regulation 30 (LODR)-Newspaper Publication
01-Jun-2026 | Source : BSENewspaper publication of Financial Results
Board Meeting Outcome for Outcome Of Board Meeting Held On 30.05.2026
30-May-2026 | Source : BSEIn continuation to the intimation dated 25.05.2026 and update on 29.05.2026 we wish to inform you that Board of Directors in its meeting held today i.e. the 30th day of May 2026 the board meeting commenced at 12.00 Noon and concluded at 02.00 P.M. inter alia considered and approved the following: The Standalone Audited Financial Results for the Quarter and Year Ended 31.03.2026. The Consolidated Audited Financial Results for the Quarter and Year Ended 31.03.2026. The Auditors Report on Standalone and Consolidated Audited Financial Results by the Statutory Auditor of the Company. Statement of Unmodified Opinion for Standalone and Consolidated Audited Financial Results.
Financial Results For The Quarter And Year Ended 31.03.2026
30-May-2026 | Source : BSEFinancial Results for the Quarter and Year ended 31.03.2026
Corporate Actions

No Upcoming Board Meetings

Sakuma Exports Ltd has declared 5% dividend, ex-date: 16 Jul 24

Sakuma Exports Ltd has announced 1:10 stock split, ex-date: 12 Nov 18

Sakuma Exports Ltd has announced 4:1 bonus issue, ex-date: 09 Aug 24

Sakuma Exports Ltd has announced 33:98 rights issue, ex-date: 15 Apr 24
Quality key factors
Valuation key factors
Technicals key factors
 Technical Indicator Scale: Bearish, Mildly Bearish, Sideways, Mildly Bullish, Bullish Turned
 Shareholding Snapshot : Mar 2026
Shareholding Compare (%holding)
Non Institution
None
Held by 0 Schemes
Held by 0 FIIs
Sakuma Infrastructure And Realty Private Limited (15.59%)
Bhartula Vjk Sharma (1.4%)
50.57%
Quarterly Results Snapshot (Consolidated) - Mar'26 - QoQ

QoQ Growth in quarter ended Mar 2026 is 96.63% vs 42.88% in Dec 2025
QoQ Growth in quarter ended Mar 2026 is 968.85% vs -16.44% in Dec 2025
Half Yearly Results Snapshot (Consolidated) - Sep'25

Growth in half year ended Sep 2025 is -41.66% vs 27.90% in Sep 2024
Growth in half year ended Sep 2025 is -65.46% vs -7.86% in Sep 2024
Nine Monthly Results Snapshot (Consolidated) - Dec'25
YoY Growth in nine months ended Dec 2025 is -36.22% vs -4.05% in Dec 2024
YoY Growth in nine months ended Dec 2025 is -70.85% vs -26.29% in Dec 2024
Annual Results Snapshot (Consolidated) - Mar'26
YoY Growth in year ended Mar 2026 is -25.39% vs 7.76% in Mar 2025
YoY Growth in year ended Mar 2026 is -35.70% vs -63.00% in Mar 2025
About Sakuma Exports Ltd

Company Coordinates


