
Compare Salguti Industri with Similar Stocks
Dashboard
High Debt company with Weak Long Term Fundamental Strength
- Poor long term growth as Operating profit has grown by an annual rate -3.50% of over the last 5 years
- High Debt Company with a Debt to Equity ratio (avg) of 3.97 times
- The company has been able to generate a Return on Equity (avg) of 2.36% signifying low profitability per unit of shareholders funds
Flat results in Mar 26
Underperformed the market in the last 1 year
Stock DNA
Packaging
INR 24 Cr (Micro Cap)
NA (Loss Making)
17
0.00%
4.13
-1.46%
2.53
Total Returns (Price + Dividend) 
Salguti Industri for the last several years.
Risk Adjusted Returns v/s
Returns Beta

News
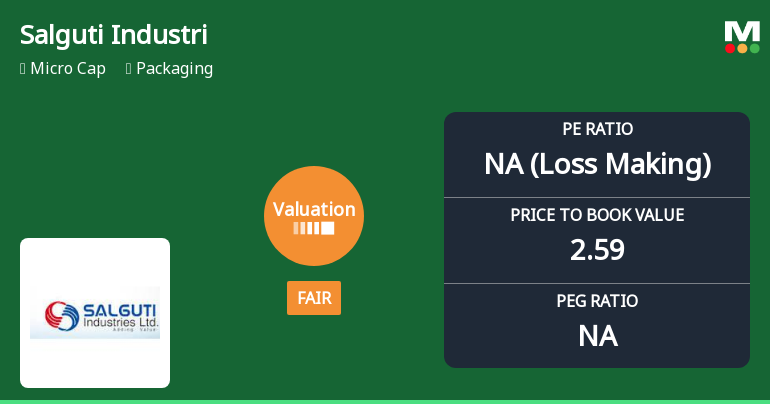
Salguti Industries Ltd Valuation Shifts: From Attractive to Fair Amid Peer Comparison
Salguti Industries Ltd, a micro-cap player in the packaging sector, has seen a notable shift in its valuation parameters, moving from an attractive to a fair rating. Despite a robust year-to-date return of 26.7%, the company’s price-to-earnings (P/E) ratio and price-to-book value (P/BV) metrics reveal a complex valuation landscape when compared with peers and historical benchmarks.
Read full news article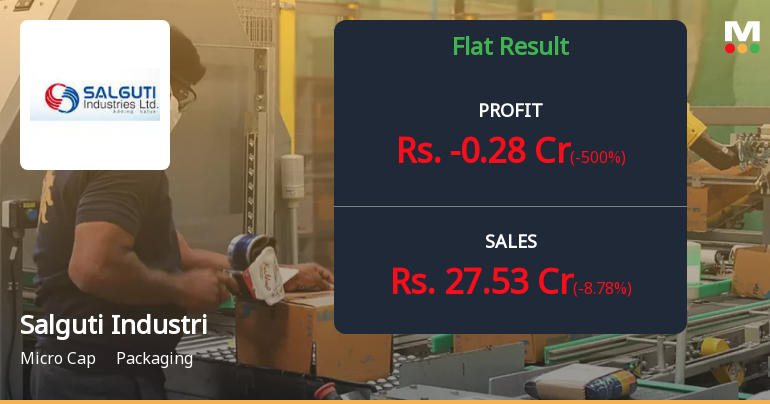
Salguti Industries Q4 FY26: Loss-Making Quarter Raises Concerns Despite Revenue Growth
Salguti Industries Ltd., a micro-cap packaging company with a market capitalisation of ₹24.00 crores, reported a concerning fourth quarter for FY26, posting a net loss of ₹0.28 crores compared to a profit of ₹0.20 crores in Q4 FY25, representing a sharp deterioration in profitability despite modest revenue growth. The company's stock, trading at ₹31.49 as of June 01, 2026, has remained flat on the day but has delivered impressive gains of 26.67% year-to-date, significantly outperforming the Sensex which declined 12.85% over the same period.
Read full news article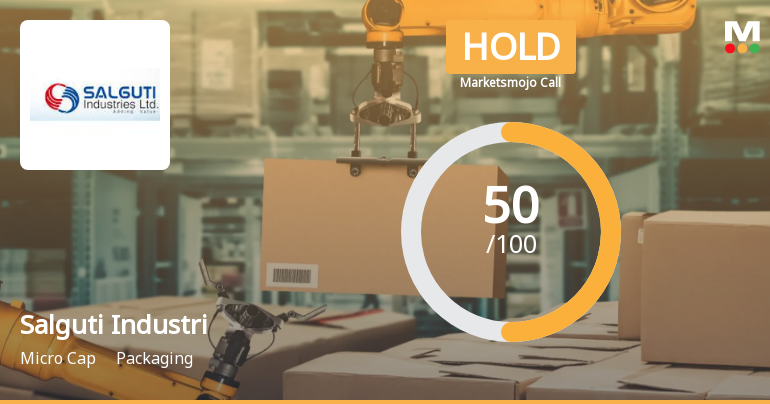
Salguti Industries Ltd is Rated Hold
Salguti Industries Ltd is rated 'Hold' by MarketsMOJO, with this rating last updated on 13 Mar 2026. However, the analysis and financial metrics discussed here reflect the company’s current position as of 15 May 2026, providing investors with the latest insights into its performance and outlook.
Read full news article Announcements
AUDITED FINANCIAL RESULTS FOR THE FOURTH QUARTER AND YEAR ENDED 31.03.2026
30-May-2026 | Source : BSEAUDITED FINANCIAL RESULTS FOR THE FOURTH QUARTER AND YEAR ENDED 31.03.2026
Board Meeting Outcome for AUDITED FINANCIAL RESULTS FOR THE 4TH QUARTER AND YEAR ENDED 31.032026
30-May-2026 | Source : BSEAUDITED FINANCIAL RESULTS FOR THE 4TH QUARTER AND YEAR ENDED 31.032026
Board Meeting Intimation for Consideration Of Financial Results For The Quarter And Year Ended 31.03.2026
22-May-2026 | Source : BSESalguti Industries Ltdhas informed BSE that the meeting of the Board of Directors of the Company is scheduled on 30/05/2026 inter alia to consider and approve Consideration of Financial Results for the Quarter and Year Ended 31.03.2026
Corporate Actions

No Upcoming Board Meetings

No Dividend history available

No Splits history available

No Bonus history available

No Rights history available
Quality key factors
Valuation key factors
Technicals key factors
 Technical Indicator Scale: Bearish, Mildly Bearish, Sideways, Mildly Bullish, Bullish Turned
 Shareholding Snapshot : Mar 2026
Shareholding Compare (%holding)
Promoters
None
Held by 0 Schemes
Held by 0 FIIs
Salguti Finance & Investments (p) Ltd., (19.3%)
Telangana State Industrial Development Corporation Limited (3.32%)
26.41%
Quarterly Results Snapshot (Standalone) - Mar'26 - QoQ

QoQ Growth in quarter ended Mar 2026 is -8.78% vs 5.97% in Dec 2025
QoQ Growth in quarter ended Mar 2026 is -500.00% vs 40.00% in Dec 2025
Half Yearly Results Snapshot (Standalone) - Sep'25

Growth in half year ended Sep 2025 is 32.86% vs -13.99% in Sep 2024
Growth in half year ended Sep 2025 is -38.46% vs -13.33% in Sep 2024
Nine Monthly Results Snapshot (Standalone) - Dec'25
YoY Growth in nine months ended Dec 2025 is 28.74% vs -4.10% in Dec 2024
YoY Growth in nine months ended Dec 2025 is 140.54% vs -408.33% in Dec 2024
Annual Results Snapshot (Standalone) - Mar'26
YoY Growth in year ended Mar 2026 is 24.72% vs 0.72% in Mar 2025
YoY Growth in year ended Mar 2026 is -181.25% vs 233.33% in Mar 2025
About Salguti Industries Ltd

Company Coordinates


