
Compare Sambandam Spg. with Similar Stocks
Dashboard
Weak Long Term Fundamental Strength with a -33.51% CAGR growth in Operating Profits over the last 5 years
- Low ability to service debt as the company has a high Debt to EBITDA ratio of 12.07 times
- The company has been able to generate a Return on Equity (avg) of 2.62% signifying low profitability per unit of shareholders funds
Negative results in Mar 26
Stock DNA
Garments & Apparels
INR 48 Cr (Micro Cap)
NA (Loss Making)
52
0.00%
1.70
-7.04%
0.60
Total Returns (Price + Dividend) 
Latest dividend: 5 per share ex-dividend date: Sep-15-2022
Risk Adjusted Returns v/s
Returns Beta

News

Sambandam Spinning Mills Ltd is Rated Strong Sell
Sambandam Spinning Mills Ltd is rated Strong Sell by MarketsMOJO. This rating was last updated on 24 May 2026, reflecting a reassessment of the stock’s outlook. However, all fundamentals, returns, and financial metrics discussed below are current as of 18 June 2026, providing investors with the latest perspective on the company’s position.
Read full news article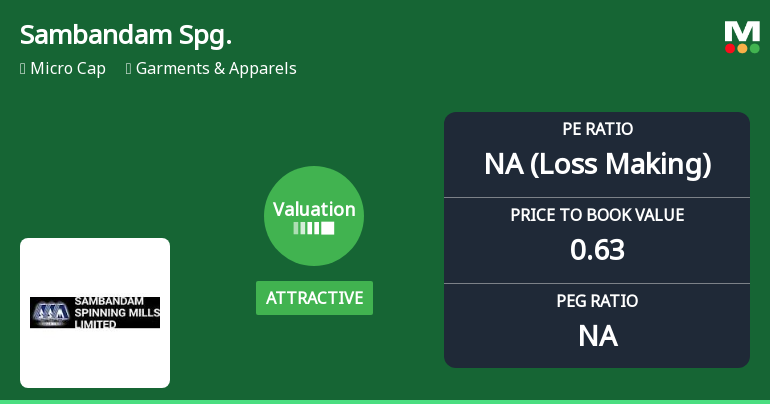
Sambandam Spinning Mills Ltd: Valuation Shift Enhances Price Attractiveness Amid Mixed Fundamentals
Sambandam Spinning Mills Ltd has witnessed a notable shift in its valuation parameters, moving from a fair to an attractive price level, despite ongoing challenges in profitability and returns. The company’s price-to-earnings (P/E) ratio has plunged into negative territory, while its price-to-book value (P/BV) remains below unity, signalling a potential value opportunity for investors amid a micro-cap status and a recent upgrade to a Strong Sell rating by MarketsMOJO.
Read full news article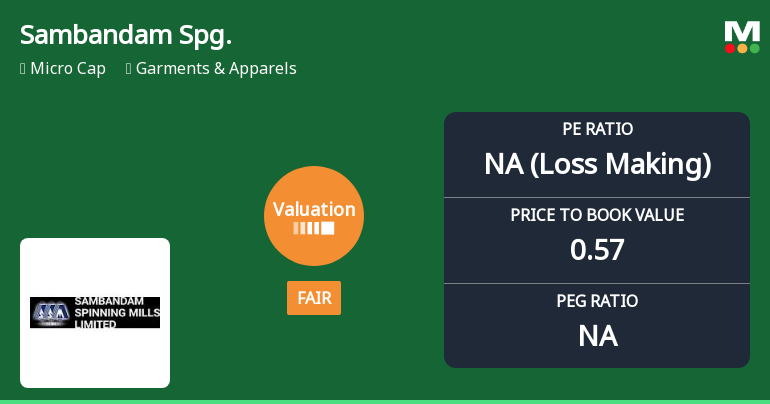
Sambandam Spinning Mills Ltd Valuation Shifts Amid Market Challenges
Sambandam Spinning Mills Ltd has witnessed a notable shift in its valuation parameters, moving from an attractive to a fair valuation grade, signalling a diminished price appeal despite its micro-cap status in the Garments & Apparels sector. This change accompanies a downgrade in its Mojo Grade to Strong Sell, reflecting growing concerns over its financial health and market performance relative to peers and broader indices.
Read full news article Announcements
Compliances-Reg.24(A)-Annual Secretarial Compliance
29-May-2026 | Source : BSEAnnual Secretarial Compliance Report for 2025-26
Audited Financial Results For The Quarter And Year Ended 31.03.2026
23-May-2026 | Source : BSEAudited Financial Results for the quarter and year ended 31.03.2026
Board Meeting Outcome for Audited Financial Results For The Quarter And Year Ended 31.03.2026
23-May-2026 | Source : BSEAudited Financial Results for the quarter and year ended 31.03.2026
Corporate Actions

No Upcoming Board Meetings

Sambandam Spinning Mills Ltd has declared 50% dividend, ex-date: 15 Sep 22

No Splits history available

No Bonus history available

No Rights history available
Quality key factors
Valuation key factors
Technicals key factors
 Technical Indicator Scale: Bearish, Mildly Bearish, Sideways, Mildly Bullish, Bullish Turned
 Shareholding Snapshot : Mar 2026
Shareholding Compare (%holding)
Promoters
None
Held by 0 Schemes
Held by 0 FIIs
Devarajan Sambandam (14.69%)
Shivani Tejas Trivedi (4.65%)
44.91%
Quarterly Results Snapshot (Consolidated) - Mar'26 - QoQ

QoQ Growth in quarter ended Mar 2026 is 4.09% vs -1.95% in Dec 2025
QoQ Growth in quarter ended Mar 2026 is -37.04% vs -103.77% in Dec 2025
Half Yearly Results Snapshot (Consolidated) - Sep'25

Growth in half year ended Sep 2025 is -8.31% vs 37.81% in Sep 2024
Growth in half year ended Sep 2025 is 83.97% vs -22.94% in Sep 2024
Nine Monthly Results Snapshot (Consolidated) - Dec'25
YoY Growth in nine months ended Dec 2025 is -3.63% vs 30.05% in Dec 2024
YoY Growth in nine months ended Dec 2025 is 64.06% vs -15.47% in Dec 2024
Annual Results Snapshot (Consolidated) - Mar'26
YoY Growth in year ended Mar 2026 is -1.80% vs 23.11% in Mar 2025
YoY Growth in year ended Mar 2026 is 22.86% vs 6.37% in Mar 2025
About Sambandam Spinning Mills Ltd

Company Coordinates


