
Compare Sampre Nutrition with Similar Stocks
Dashboard
Weak Long Term Fundamental Strength with an average Return on Capital Employed (ROCE) of 1.28%
- Poor long term growth as Operating profit has grown by an annual rate 18.30% of over the last 5 years
- Company's ability to service its debt is weak with a poor EBIT to Interest (avg) ratio of 0.47
Below par performance in long term as well as near term
Total Returns (Price + Dividend) 
Sampre Nutrition for the last several years.
Risk Adjusted Returns v/s
Returns Beta

News

Sampre Nutritions Ltd Falls to 52-Week Low of Rs 5.55 as Sell-Off Deepens
For the eighth consecutive session, Sampre Nutritions Ltd has closed lower, culminating in a fresh 52-week low of Rs 5.55 on 13 Jul 2026. This sustained decline has dragged the stock down by 28.21% over this period, sharply underperforming its FMCG sector peers and the broader market indices.
Read full news article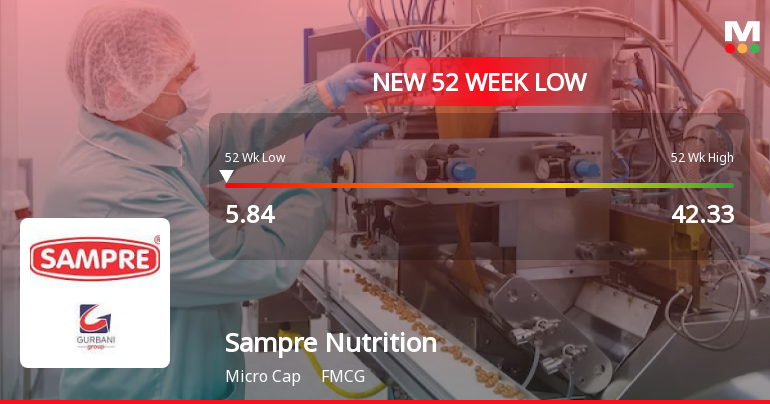
Sampre Nutritions Ltd Falls to 52-Week Low of Rs 5.84 as Sell-Off Deepens
For the seventh consecutive session, Sampre Nutritions Ltd has closed lower, culminating in a fresh 52-week low of Rs 5.84 on 10 Jul 2026. This marks a steep 26.09% decline over the past week, sharply underperforming its FMCG sector peers and the broader market indices.
Read full news article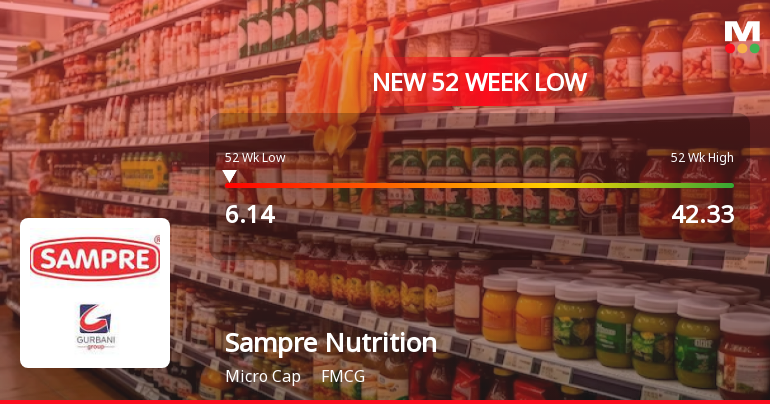
Sampre Nutritions Ltd Falls to 52-Week Low of Rs 6.14 as Sell-Off Deepens
For the sixth consecutive session, Sampre Nutritions Ltd has closed lower, culminating in a fresh 52-week low of Rs 6.14 on 9 Jul 2026, marking a near 20% decline over this period amid broader market gains.
Read full news article Announcements
Compliances-Certificate under Reg. 74 (5) of SEBI (DP) Regulations 2018
13-Jul-2026 | Source : BSECertificate under Regulation 74(5) of the SEBI (DP) Regulations for the first quarter ended on 30 June 2026.
Format of the Initial Disclosure to be made by an entity identified as a Large Corporate : Annexure A
20-Jun-2026 | Source : BSEFormat of Initial Disclosure to be made by an entity identified as a Large Corporate.
| Sr. No. | Particulars | Details |
| 1 | Name of Company | Sampre Nutritions Ltd |
| 2 | CIN NO. | L15499TG1991PLC013515 |
| 3 | Outstanding borrowing of company as on 31st March / 31st December as applicable (in Rs cr) | 12.75 |
| 4 | Highest Credit Rating during the previous FY | NA |
| 4a | Name of the Credit Rating Agency issuing the Credit Rating mentioned in (4) | Not Applicable |
| 5 | Name of Stock Exchange# in which the fine shall be paid in case of shortfall in the required borrowing under the framework | BSE |
Designation: COMPANY SECRETARY AND COMPLIANCE OFFICER
EmailId: gurbani@gurbanigroup.in
Designation: Chief Financial Officer
EmailId: vamshi@gurbanigroup.in
Date: 20/06/2026
Note: In terms para of 3.2(ii) of the circular beginning F.Y 2022 in the event of shortfall in the mandatory borrowing through debt securities a fine of 0.2% of the shortfall shall be levied by Stock Exchanges at the end of the two-year block period. Therefore an entity identified as LC shall provide in its initial disclosure for a financial year the name of Stock Exchange to which it would pay the fine in case of shortfall in the mandatory borrowing through debt markets.
Closure of Trading Window
20-Jun-2026 | Source : BSEIntimation of closure of trading window for the announcement of unaudited standalone and consolidated financial results for the first quarter of the financial year 2026-27 ended on 30 June 2026.
Corporate Actions

No Upcoming Board Meetings

No Dividend history available

Sampre Nutritions Ltd has announced 5:10 stock split, ex-date: 14 Nov 25

Sampre Nutritions Ltd has announced 1:1 bonus issue, ex-date: 14 Nov 25

No Rights history available
Quality key factors
Valuation key factors
Technicals key factors
 Technical Indicator Scale: Bearish, Mildly Bearish, Sideways, Mildly Bullish, Bullish Turned
 Shareholding Snapshot : Jun 2026
Shareholding Compare (%holding)
Non Institution
None
Held by 0 Schemes
Held by 0 FIIs
Brahma Gurbani (5.84%)
Wave Capital Ltd (9.42%)
45.43%
Quarterly Results Snapshot (Consolidated) - Mar'26 - QoQ

QoQ Growth in quarter ended Mar 2026 is 104.33% vs -26.10% in Dec 2025
QoQ Growth in quarter ended Mar 2026 is 117.74% vs -31.11% in Dec 2025
Half Yearly Results Snapshot (Consolidated) - Sep'25
Not Applicable: The company has declared_date for only one period
Not Applicable: The company has declared_date for only one period
Nine Monthly Results Snapshot (Consolidated) - Dec'25
Not Applicable: The company has declared_date for only one period
Not Applicable: The company has declared_date for only one period
Annual Results Snapshot (Consolidated) - Mar'26
YoY Growth in year ended Mar 2026 is 72.57% vs -0.12% in Mar 2025
YoY Growth in year ended Mar 2026 is 140.16% vs -3,434.78% in Mar 2025
About Sampre Nutritions Ltd

Company Coordinates


