
Compare Sampre Nutrition with Similar Stocks
Dashboard
Weak Long Term Fundamental Strength with an average Return on Capital Employed (ROCE) of 1.28%
- Poor long term growth as Operating profit has grown by an annual rate 18.30% of over the last 5 years
- Company's ability to service its debt is weak with a poor EBIT to Interest (avg) ratio of 0.47
Total Returns (Price + Dividend) 
Sampre Nutrition for the last several years.
Risk Adjusted Returns v/s
Returns Beta

News

Sampre Nutritions Ltd is Rated Sell
Sampre Nutritions Ltd is rated 'Sell' by MarketsMOJO, with this rating last updated on 01 June 2026. However, the analysis and financial metrics discussed here reflect the company’s current position as of 16 June 2026, providing investors with the most up-to-date insight into the stock’s fundamentals, valuation, financial trends, and technical outlook.
Read full news article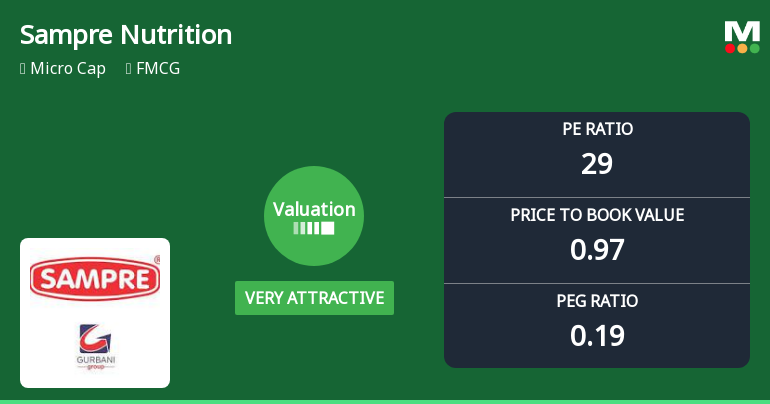
Sampre Nutritions Ltd Valuation Shifts Signal Renewed Price Attractiveness
Sampre Nutritions Ltd has witnessed a significant shift in its valuation parameters, moving from a fair to a very attractive rating, despite recent share price declines. This article analyses the evolving price-to-earnings (P/E) and price-to-book value (P/BV) ratios in the context of historical trends, peer comparisons, and broader market performance, providing a comprehensive view for investors assessing the stock’s current appeal.
Read full news article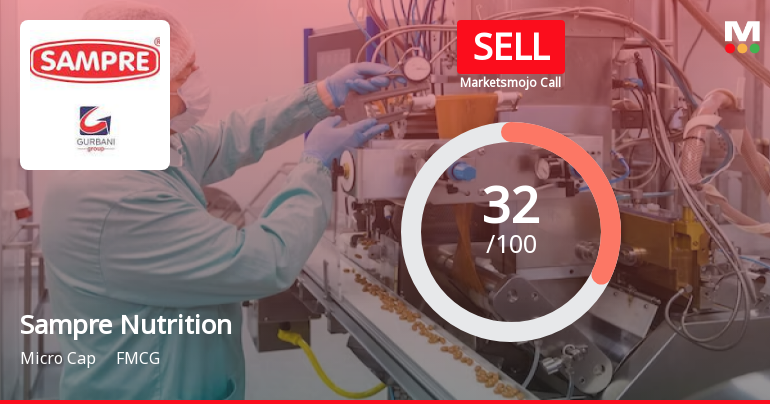
Sampre Nutritions Ltd is Rated Sell
Sampre Nutritions Ltd is rated 'Sell' by MarketsMOJO, with this rating last updated on 01 June 2026. However, the analysis and financial metrics discussed here reflect the stock's current position as of 08 June 2026, providing investors with the latest insights into the company’s performance and outlook.
Read full news article Announcements
Announcement under Regulation 30 (LODR)-Newspaper Publication
30-May-2026 | Source : BSENewspaper publication of the audited standalone and consolidated financial results for the year ended 31 March 2026.
Compliances-Reg.24(A)-Annual Secretarial Compliance
30-May-2026 | Source : BSEAnnual Secretarial Compliance Report for the financial year ended 31 March 2026.
Voluntary Disclosure Regarding Acknowledgement Of A Long-Standing Business Association
29-May-2026 | Source : BSEPursuant to Regulation 30 of the SEBI (LODR) Regulations 2015 we are enclosing a commemorative communication issued by the Company acknowledging approximately thirty (30) years of business association with a long standing commercial counterparty. This announcement is being made voluntarily for information purposes only and does not relate to any new agreement partnership joint venture strategic alliance or any other material event.
Corporate Actions

No Upcoming Board Meetings

No Dividend history available

Sampre Nutritions Ltd has announced 5:10 stock split, ex-date: 14 Nov 25

Sampre Nutritions Ltd has announced 1:1 bonus issue, ex-date: 14 Nov 25

No Rights history available
Quality key factors
Valuation key factors
Technicals key factors
 Technical Indicator Scale: Bearish, Mildly Bearish, Sideways, Mildly Bullish, Bullish Turned
 Shareholding Snapshot : Mar 2026
Shareholding Compare (%holding)
Non Institution
None
Held by 0 Schemes
Held by 1 FIIs (0.43%)
Brahma Gurbani (5.84%)
Wave Capital Ltd (9.42%)
36.84%
Quarterly Results Snapshot (Consolidated) - Mar'26 - QoQ

QoQ Growth in quarter ended Mar 2026 is 104.33% vs -26.10% in Dec 2025
QoQ Growth in quarter ended Mar 2026 is 117.74% vs -31.11% in Dec 2025
Half Yearly Results Snapshot (Consolidated) - Sep'25
Not Applicable: The company has declared_date for only one period
Not Applicable: The company has declared_date for only one period
Nine Monthly Results Snapshot (Consolidated) - Dec'25
Not Applicable: The company has declared_date for only one period
Not Applicable: The company has declared_date for only one period
Annual Results Snapshot (Consolidated) - Mar'26
YoY Growth in year ended Mar 2026 is 72.57% vs -0.12% in Mar 2025
YoY Growth in year ended Mar 2026 is 140.16% vs -3,434.78% in Mar 2025
About Sampre Nutritions Ltd

Company Coordinates


