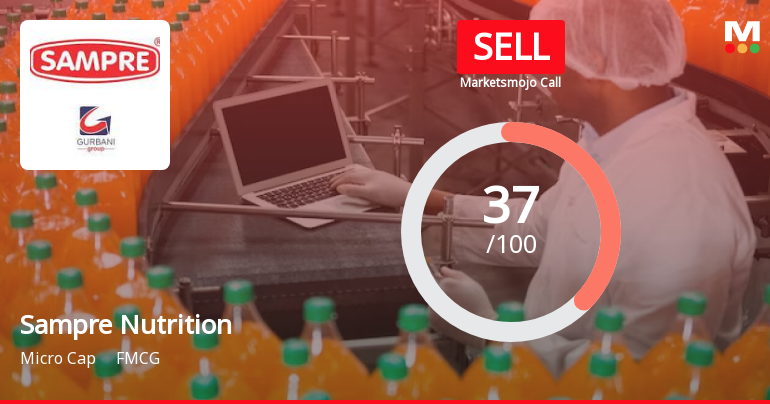
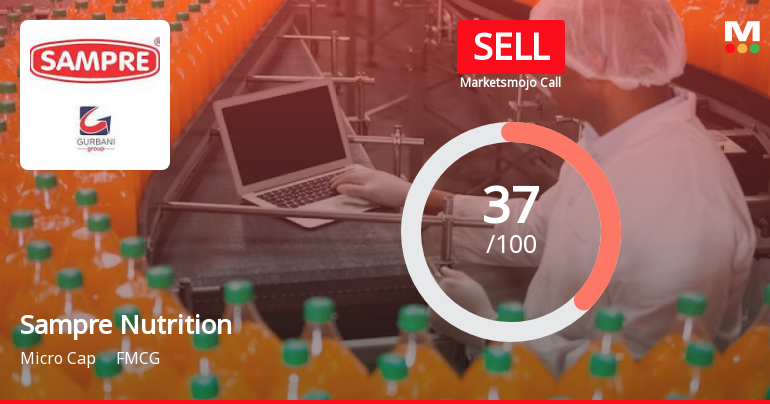
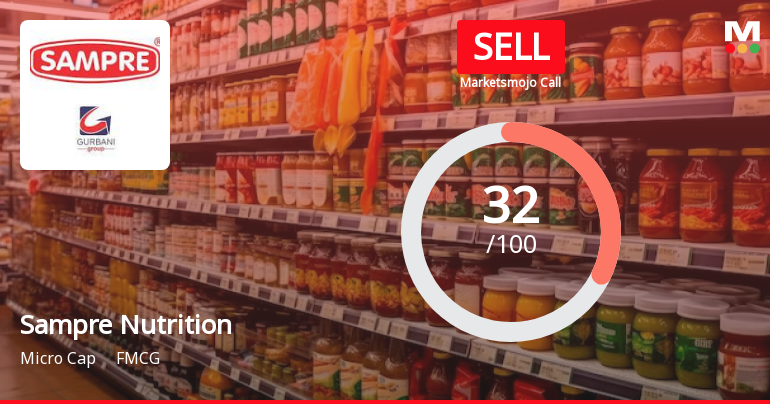
Sampre Nutrition

  • Market Cap: Micro Cap
  • Industry: FMCG
  • ISIN: INE375C01022
  • NSEID:
  • BSEID: 530617
INR
5.85
0.27 (4.84%)
BSENSE

Aug 11, 12:53 PM

BSE+NSE Vol: 2.39 lacs

  • Price Points
  • Score
  • Mojo Parameters
  • Total Return
  • News and Corporate Actions
  • Key factors
  • Shareholding
  • Financials
  • CompanyCV
stock-summaryPrice Point
High/Low

1Day

52 Week

Valuation
Technical
Day's Volume

CASH

2.39 lacs (56.34%) Volume

Shareholding (Jun 2026)

FII

0.00%

Held by 0 FIIs

DII

0.00%

Held by 0 DIIs

Promoter

14.04%

Why is Sampre Nutritions Ltd falling/rising?

11-Aug-2026

As of 10-Aug, Sampre Nutritions Ltd's stock price is rising to 5.58, reflecting a 4.49% increase. This short-term gain contrasts with significant long-term declines, indicating potential ongoing pressure despite recent outperformance in the sector.

As of 10-Aug, Sampre Nutritions Ltd's stock price is rising, currently at 5.58, which reflects a change of 0.24 or 4.49% increase. This upward movement can be attributed to several factors. Notably, the stock has outperformed its sector by 4.64% today and has experienced consecutive gains over the last two days, accumulating a total return of 8.12% during this period. <BR><BR>Additionally, the stock's performance over the past week shows a significant increase of 18.72%, contrasting sharply with the Sensex, which has seen a slight decline of 0.12%. However, it is important to note that despite this recent rise, the stock has faced challenges over longer periods, including a year-to-date decline of 77.57% and a one-year drop of 63.27%. <BR><BR>The current price is higher than the 5-day moving average, indicating short-term strength, although it remains below the longer-term moving averages of 20, 50, 100, and 200 days. This suggests that while there is a short-term positive trend, the stock may still be under pressure in the longer term. Furthermore, there has been a notable decrease in investor participation, with delivery volume falling by 54.46% compared to the 5-day average, which could indicate a lack of sustained interest from investors. <BR><BR>In summary, the recent rise in Sampre Nutritions Ltd's stock price is primarily driven by short-term gains and outperformance against the sector, despite the overall long-term challenges the stock has faced.

View full answer

Should I buy, sell or hold Sampre Nutritions Ltd?

07-Aug-2026

Are Sampre Nutritions Ltd latest results good or bad?

05-Aug-2026

Sampre Nutritions Ltd's latest results show strong revenue growth and a return to profitability, but concerns about declining operating margins and reliance on tax credits raise doubts about sustainability. Investors should proceed with caution and monitor future performance closely.

Sampre Nutritions Ltd's latest results present a mixed picture. On one hand, the company reported a significant increase in revenue and net profit for Q4 FY26, with net sales rising by 104.33% quarter-on-quarter to ₹15.10 crores and a net profit of ₹1.35 crores, marking a 117.74% increase from the previous quarter. This revenue growth is impressive and indicates a strong volume expansion in their core business.<BR><BR>However, there are serious concerns regarding the sustainability of this performance. The operating margin has plummeted to just 2.85%, down from 20.16% in the previous quarter, which raises questions about the company's operational efficiency. Additionally, the net profit was heavily influenced by a substantial tax credit, suggesting that the underlying profitability may not be as strong as it appears.<BR><BR>The company has also faced significant challenges over the past year, including a 47.39% decline in stock price year-to-date and a bearish technical trend. Furthermore, the average return on equity (ROE) is only 2.77%, which is below industry standards, indicating poor capital efficiency.<BR><BR>In summary, while the latest results show positive growth in revenue and a return to profitability, the sharp decline in operating margins and reliance on one-time tax benefits cast doubt on whether this performance can be sustained. Investors should be cautious and closely monitor upcoming quarters to see if the company can maintain this momentum.

View full answer

What does Sampre Nutrition do?

11-Jun-2026

Sampre Nutritions Ltd manufactures sugar candies and operates in the FMCG sector, primarily producing candy products for Cadbury India Ltd. As of March 2026, it reported net sales of 15 Cr and a net profit of 1 Cr, with a market cap of INR 108 Cr.

Overview: <BR>Sampre Nutritions Ltd is engaged in the manufacturing of sugar candies and operates within the FMCG industry, categorized as a micro-cap company.<BR><BR>History: <BR>Incorporated in 1991, Sampre Nutritions Ltd was promoted by The Gurbani Group. The company has been manufacturing candy products for Cadbury India Ltd since August 1996 and entered into an agreement to manufacture "DAIRY MILK ECLAIRS" in 2000. The latest reported quarter for net sales and profit is March 2026.<BR><BR>Financial Snapshot: <BR>Most recent Net Sales: 15 Cr (Quarterly Results - Mar 2026) <BR>Most recent Net Profit: 1 Cr (Quarterly Results - Mar 2026) <BR>Market-cap value: INR 108 Cr (Micro Cap)<BR><BR>Key Metrics: <BR>P/E: 31.00 <BR>Industry P/E: 45 <BR>Dividend Yield: 0.00% <BR>Debt-Equity: 0.17 <BR>Return on Equity: 3.33% <BR>Price to Book: 0.98 <BR><BR>Contact Details: <BR>Address: P No 133 Indl Estate, Medchal Telangana: 501401 <BR>Tel: 91-08418-222427/28 <BR>Email: gurbani@gurbanigroup.in <BR>Website: http://www.sampreltd.com

View full answer

How big is Sampre Nutrition?

11-Jun-2026

As of 10th June, Sampre Nutritions Ltd has a market capitalization of 108.00 Cr, with recent net sales of 43.36 Cr and a net profit of 3.58 Cr. Shareholder's funds are 90.88 Cr and total assets are valued at 115.43 Cr as of March 2025.

As of 10th June, Sampre Nutritions Ltd has a market capitalization of 108.00 Cr, categorizing it as a Micro Cap company.<BR><BR>In the latest four quarters, Sampre Nutritions Ltd reported Net Sales of 43.36 Cr and a Net Profit of 3.58 Cr.<BR><BR>The latest annual period for the balance sheet is March 2025, with Shareholder's Funds amounting to 90.88 Cr and Total Assets valued at 115.43 Cr.

View full answer

Who are in the management team of Sampre Nutrition?

11-Jun-2026

The management team of Sampre Nutrition includes B K Gurbani (Managing Director), Vishal Ratan Gurbani (Vice President & Whole-Time Director), and several Independent Directors: Banala Jayaprakash Reddy, Umra Singh Sirohi, and Vimal Suresh, along with Deepak Bissa (Company Secretary & Compliance Officer).

The management team of Sampre Nutrition includes the following individuals:<BR><BR>1. **B K Gurbani** - Managing Director<BR>2. **Banala Jayaprakash Reddy** - Independent Director<BR>3. **Umra Singh Sirohi** - Independent Director<BR>4. **Vishal Ratan Gurbani** - Vice President & Whole-Time Director<BR>5. **Vimal Suresh** - Independent Director<BR>6. **Deepak Bissa** - Company Secretary & Compliance Officer<BR><BR>If you need more details about their roles or contributions, feel free to ask!

View full answer

Who are the peers of the Sampre Nutrition?

11-Jun-2026

Sampre Nutrition's peers include Tirupati Starch, Norben Tea, Valencia Nutrit., and others. It has below-average management risk and growth, with a 1-year return of 97.50%, lower than Norben Tea's 124.56% but higher than B & A's -28.65%.

Peers: The peers of Sampre Nutrition are Tirupati Starch, Norben Tea, Valencia Nutrit., Tanvi Foods, Mayank Cattle Fo, Vistar Amar, B & A, Thrive Future Ha, and James Warren Tea.<BR><BR>Quality Snapshot: Excellent management risk is observed at Vistar Amar, while Average management risk is found at Tirupati Starch, Norben Tea, Mayank Cattle Fo, B & A, and James Warren Tea. Below Average management risk is present at Sampre Nutrition, Valencia Nutrit., Tanvi Foods, Thrive Future Ha, and Grob Tea Co. Growth is classified as Excellent at Vistar Amar, Good at Valencia Nutrit., and Below Average at Sampre Nutrition, Tirupati Starch, Norben Tea, Tanvi Foods, Thrive Future Ha, and Grob Tea Co. Capital Structure ratings show Excellent at Vistar Amar, Average at B & A, and Below Average at Sampre Nutrition, Tirupati Starch, Norben Tea, Valencia Nutrit., Tanvi Foods, Mayank Cattle Fo, Thrive Future Ha, James Warren Tea, and Grob Tea Co.<BR><BR>Return Snapshot: Norben Tea has the highest 1-year return at 124.56%, while B & A has the lowest at -28.65%. Sampre Nutrition's 1-year return of 97.50% is significantly higher than B & A's but lower than Norben Tea's. Additionally, the six-month returns for Tirupati Starch, Valencia Nutrit., Sampre Nutrition, Tanvi Foods, Thrive Future Ha, James Warren Tea, and Grob Tea Co. are all negative.

View full answer

When is the next results date for Sampre Nutritions Ltd?

12-Feb-2026

The next results date for Sampre Nutritions Ltd is 13 February 2026.

The next results date for Sampre Nutritions Ltd is scheduled for 13 February 2026.

View full answer

How has been the historical performance of Sampre Nutrition?

06-Nov-2025

Sampre Nutrition experienced a significant decline in financial health from March 2024 to March 2025, with net sales slightly decreasing and total expenditure rising sharply, resulting in a negative operating profit and a loss after tax of -7.67 Cr. Despite an increase in total assets, the company's financial outlook is concerning due to negative profit margins and escalating costs.

Answer:<BR>The historical performance of Sampre Nutrition shows a significant decline in financial health from March 2024 to March 2025.<BR><BR>Breakdown:<BR>In the fiscal year ending March 2025, Sampre Nutrition reported net sales of 25.12 Cr, a slight decrease from 25.15 Cr in the previous year. Total operating income mirrored this trend, remaining nearly unchanged at 25.12 Cr compared to 25.15 Cr in March 2024. However, total expenditure saw a substantial increase to 28.99 Cr from 21.02 Cr, primarily driven by a rise in employee costs from 7.75 Cr to 10.81 Cr and other expenses escalating from 3.74 Cr to 9.82 Cr. This led to an operating profit (PBDIT) of -3.50 Cr, a stark contrast to the positive 4.25 Cr reported in the prior year. Consequently, profit before tax plummeted to -7.52 Cr from 0.49 Cr, resulting in a profit after tax of -7.67 Cr compared to a modest profit of 0.23 Cr in March 2024. The earnings per share also reflected this downturn, falling to -3.65 from 0.32. On the balance sheet, total liabilities surged to 115.43 Cr from 44.75 Cr, while total assets increased to the same figure, indicating a significant rise in the company's financial obligations. The book value per share improved to 42.44 from 26.75, but the overall financial outlook for Sampre Nutrition appears concerning, with negative profit margins and increasing costs overshadowing any positive asset growth.

View full answer

Who are the top shareholders of the Sampre Nutrition?

17-Jul-2025

The top shareholder of Sampre Nutrition is Wave Capital Ltd, holding 12.52% of the shares. Individual shareholders own 31.28%, with Brahma Gurbani as the largest promoter at 4.94%, and there are no pledged promoter holdings or investments from mutual funds or foreign institutional investors.

The top shareholders of Sampre Nutrition include Wave Capital Ltd, which holds the largest public share at 12.52%. Among individual shareholders, they collectively own 31.28% of the company. The promoter with the highest holding is Brahma Gurbani, who owns 4.94%. There are no pledged promoter holdings, and the company does not have any mutual funds or foreign institutional investors holding shares.

View full answer

Is Sampre Nutrition overvalued or undervalued?

09-Jun-2025

As of June 5, 2025, Sampre Nutrition is considered overvalued with a risky valuation grade, reflected by a PE ratio of -7.39, an EV to EBITDA ratio of -19.19, and a troubling ROE of -35.54%, significantly underperforming its peers and the market with a year-to-date return of -60.75%.

As of 5 June 2025, Sampre Nutrition's valuation grade has moved from expensive to risky, indicating a significant shift in its perceived value. The company is currently assessed as overvalued. Key ratios highlight its precarious position: the PE ratio stands at -7.39, the EV to EBITDA ratio is at -19.19, and the ROE is a concerning -35.54%. <BR><BR>In comparison to its peers, Sampre Nutrition's metrics are starkly unfavorable; for instance, Hindustan Unilever has a PE ratio of 53.88, while Nestlé India boasts a PE of 75.2. This stark contrast underscores the challenges Sampre faces in the FMCG sector. Additionally, the company's stock performance has been disappointing, with a year-to-date return of -60.75%, significantly underperforming the Sensex's 5.62% return.

View full answer

What is the technical trend for Sampre Nutrition?

09-Jun-2025

As of June 4, 2025, Sampre Nutrition's technical trend has shifted to a moderate bearish stance, supported by bearish signals from Bollinger Bands, moving averages, and monthly MACD, despite some mildly bullish indicators on the weekly timeframe.

As of 4 June 2025, the technical trend for Sampre Nutrition has changed from mildly bearish to bearish. The current stance is bearish with a moderate strength. Key indicators driving this include the weekly MACD showing mildly bullish but the monthly MACD is bearish, indicating a divergence in trends. The Bollinger Bands are bearish on both weekly and monthly time frames, reinforcing the bearish outlook. Daily moving averages are also bearish. The KST shows a mildly bullish signal on the weekly but is bearish on the monthly, while the Dow Theory indicates a mildly bearish stance on the weekly with no trend on the monthly. Overall, the combination of these indicators suggests a bearish sentiment in the current market environment.

View full answer

Has Sampre Nutrition declared dividend?

06-Jun-2025

No Dividend History Available

iScoreScore
Click here to find our call on this stock
Strong Sell
Sell
Hold
Buy
Strong Buy

Dashboard

1

Weak Long Term Fundamental Strength with an average Return on Capital Employed (ROCE) of 1.28%

  • Poor long term growth as Operating profit has grown by an annual rate 14.75% of over the last 5 years
  • Company's ability to service its debt is weak with a poor EBIT to Interest (avg) ratio of 0.45
2

Consistent Underperformance against the benchmark over the last 3 years

stock-summaryMojo Parameters

Mojo Parameters

Loading Valuation Snapshot...

Stock DNA

stock-summary
Industry

FMCG

stock-summary
Market cap

INR 56 Cr (Micro Cap)

stock-summary
P/E

15.00

stock-summary
Industry P/E

46

stock-summary
Dividend Yield

0.00%

stock-summary
Debt Equity

0.17

stock-summary
Return on Equity

3.33%

stock-summary
Price to Book

0.49

Revenue and Profits:
Net Sales:
15 Cr
(Quarterly Results - Jun 2026)
Net Profit:
1 Cr
stock-summaryTotal Returns
Total Returns (Price + Dividend) stock-summary
Dividend Yield (0%)
TimePeriod
Price Return
Dividend Return
Total Return
3 Months
-64.07%
0%
-64.07%
6 Months
-75.92%
0%
-75.92%
1 Year
-62.23%
0%
-62.23%
2 Years
-69.47%
0%
-69.47%
3 Years
-58.95%
0%
-58.95%
4 Years
-67.43%
0%
-67.43%
5 Years
0%
0%
0.0%

Sampre Nutrition for the last several years.

Risk Adjusted Returns v/s stock-summary
Returns Beta
Icon
Beta has not been calculated since enough price history is not available
stock-summaryNews & Corporate Actions

News

Sampre Nutritions Gains 8.54%: 3 Key Factors Driving the Weekly Rally

Key Events This Week

03 Aug: Stock hits 52-week low at Rs.4.70

04 Aug: Further decline to Rs.4.93, slight rebound after prolonged downtrend

06 Aug: Positive quarterly growth reported; stock closes at Rs.5.17

07 Aug: Week closes at Rs.5.34, up 3.29% on the day

Announcements stock-summary

Announcement under Regulation 30 (LODR)-Newspaper Publication

07-Aug-2026 | Source : BSE

Newspaper publication of the unaudited standalone and consolidated financial results of the company for the first quarter ended 30 June 2026 for the financial year 2026-27.

Board Meeting Outcome for Audited Financial Results For The First Quarter Ended 30 June 2026 Approval Of AGM Notice And Proposal To Revise Remuneration For Vishal Ratan Gurbani

05-Aug-2026 | Source : BSE

(i) In compliance with Regulation 33 of the SEBI (LODR) Regulations 2015 the unaudited standalone and consolidated financial results along with the limited review report is attached for the first quarter ended 30 June 2026 for the financial year 2026-27; (ii) Approval of the 35th AGM of the Company to be held on VC/OAVM Mode on Friday 04 September 2026 at 11:00 A.M. (IST); and (iii) Proposal to revise the remuneration to Vishal Ratan Gurbani Whole-time Director of the Company from INR 18 Lakhs per annum to INR 60 Lakhs per annum with effect from 01 April 2026 subject to the approval of the members of the company in the ensuing AGM.

Board Meeting Intimation for Approving Q1 Results Finalising The AGM Notice; And Proposal To Increase The Remuneration For Vishal Gurbani Whole-Time Director From INR 18 Lakhs Per Annum To INR 60 Lakhs Per Annum.

31-Jul-2026 | Source : BSE

Sampre Nutritions Ltdhas informed BSE that the meeting of the Board of Directors of the Company is scheduled on 05/08/2026 inter alia to consider and approve 1. Unaudited standalone and consolidated financial results of the Company for the first quarter ended 30 June 2026 for the financial year 2026-27. 2. Fix the date time and venue for the Thirty-Fifth (35th) Annual General Meeting (AGM) of the Company and to approve the Notice of AGM and other matters connected therewith. 3. Proposal to increase the remuneration for Vishal Gurbani (DIN: 07738685) Whole-Time Director of the Company from INR 1800000 (Indian Rupees Eighteen Lakhs) only per annum to INR 6000000 (Indian Rupees Sixty Lakhs) only per annum with effect from 01 April 2026 subject to the approval of the members at the ensuing AGM of the Company.

Corporate Actions stock-summary

stock-summary
BOARD MEETING

No Upcoming Board Meetings

stock-summary
DIVIDEND

No Dividend history available

stock-summary
SPLITS

Sampre Nutritions Ltd has announced 5:10 stock split, ex-date: 14 Nov 25

stock-summary
BONUS

Sampre Nutritions Ltd has announced 1:1 bonus issue, ex-date: 14 Nov 25

stock-summary
RIGHTS

No Rights history available

stock-summaryKey Factors

Quality key factors stock-summary

Factor
Value
Sales Growth (5y)
19.77%
EBIT Growth (5y)
14.75%
EBIT to Interest (avg)
0.45
Debt to EBITDA (avg)
2.86
Net Debt to Equity (avg)
0.17
Sales to Capital Employed (avg)
0.61
Tax Ratio
Tax Ratio is Negative%
Dividend Payout Ratio
0
Pledged Shares
0
Institutional Holding
0
ROCE (avg)
4.22%
ROE (avg)
1.67%

Valuation key factors

Factor
Value
P/E Ratio
15
Industry P/E
46
Price to Book Value
0.49
EV to EBIT
22.10
EV to EBITDA
13.21
EV to Capital Employed
0.57
EV to Sales
1.50
PEG Ratio
0.10
Dividend Yield
NA
ROCE (Latest)
2.56%
ROE (Latest)
3.33%

Technicals key factors

Indicator
Weekly
Monthly
MACD
Bearish
Bearish
RSI
No Signal
No Signal
Bollinger Bands
Mildly Bearish
Mildly Bearish
Moving Averages
Bearish (Daily)
KST
Bearish
Mildly Bearish
Dow Theory
Mildly Bearish
Mildly Bearish
stock-summary Technical Indicator Scale: Bearish, Mildly Bearish, Sideways, Mildly Bullish, Bullish  Turned 
stock-summaryShareholding
Shareholding Snapshot : Jun 2026stock-summary
Shareholding Compare (%holding) stock-summary
Majority shareholders

Non Institution

Pledged Promoter Holdings

None

Mutual Funds

Held by 0 Schemes

FIIs

Held by 0 FIIs

Promoter with highest holding

Brahma Gurbani (5.84%)

Highest Public shareholder

Wave Capital Ltd (9.42%)

Individual Investors Holdings

45.43%

stock-summaryFinancial
[
  {
    "link": "quarterly",
    "btn_text": "All Quarterly Results",
    "header": "Quarterly Results Snapshot (Consolidated) - Jun'26 - QoQ",
    "rhs": [
      {
        "prefix": "Net Sales ",
        "suffix": "QoQ Growth in quarter ended Jun 2026 is -1.66% vs 104.33% in Mar 2026",
        "dir": -1
      },
      {
        "prefix": "Consolidated Net Profit ",
        "suffix": "QoQ Growth in quarter ended Jun 2026 is -48.15% vs 117.74% in Mar 2026",
        "dir": -1
      }
    ],
    "table": {
      "header": [
        "Jun'26",
        "Mar'26",
        "Change(%)"
      ],
      "body": [
        {
          "field": "Net Sales",
          "val1": "14.85",
          "val2": "15.10",
          "chgp": "-1.66%",
          "chgp_class": "negative"
        },
        {
          "field": "Operating Profit (PBDIT) excl Other Income",
          "val1": "1.50",
          "val2": "0.43",
          "chgp": "248.84%",
          "chgp_class": "positive"
        },
        {
          "field": "Interest",
          "val1": "0.26",
          "val2": "0.51",
          "chgp": "-49.02%",
          "chgp_class": "positive"
        },
        {
          "field": "Exceptional Items",
          "val1": "0.00",
          "val2": "0.00",
          "chgp": "",
          "chgp_class": "neutral"
        },
        {
          "field": "Consolidate Net Profit",
          "val1": "0.70",
          "val2": "1.35",
          "chgp": "-48.15%",
          "chgp_class": "negative"
        },
        {
          "field": "Operating Profit Margin (Excl OI)",
          "val1": "10.10%",
          "val2": "2.85%",
          "chgp": "7.25%",
          "chgp_class": "positive"
        }
      ]
    }
  },
  {
    "link": "half-yearly",
    "btn_text": "All Half Yearly Results",
    "header": "Half Yearly Results Snapshot (Consolidated) - Sep'25",
    "rhs": [
      {
        "prefix": "Net Sales ",
        "suffix": "Not Applicable: The company has declared_date for only one period",
        "dir": 0
      },
      {
        "prefix": "Consolidated Net Profit ",
        "suffix": "Not Applicable: The company has declared_date for only one period",
        "dir": 0
      }
    ],
    "table": {
      "header": [
        "Sep'25",
        "Sep'24",
        "Change(%)"
      ],
      "body": [
        {
          "field": "Net Sales",
          "val1": "20.86",
          "val2": "11.78",
          "chgp": "77.08%",
          "chgp_class": "positive"
        },
        {
          "field": "Operating Profit (PBDIT) excl Other Income",
          "val1": "3.33",
          "val2": "1.97",
          "chgp": "69.04%",
          "chgp_class": "positive"
        },
        {
          "field": "Interest",
          "val1": "0.59",
          "val2": "0.90",
          "chgp": "-34.44%",
          "chgp_class": "positive"
        },
        {
          "field": "Exceptional Items",
          "val1": "0.00",
          "val2": "0.00",
          "chgp": "",
          "chgp_class": "neutral"
        },
        {
          "field": "Consolidate Net Profit",
          "val1": "1.60",
          "val2": "0.22",
          "chgp": "627.27%",
          "chgp_class": "positive"
        },
        {
          "field": "Operating Profit Margin (Excl OI)",
          "val1": "15.96%",
          "val2": "16.72%",
          "chgp": "-0.76%",
          "chgp_class": "negative"
        }
      ]
    }
  },
  {
    "link": "nine-monthly",
    "btn_text": "All Nine Monthly Results",
    "header": "Nine Monthly Results Snapshot (Consolidated) - Dec'25",
    "rhs": [
      {
        "prefix": "Net Sales ",
        "suffix": "Not Applicable: The company has declared_date for only one period",
        "dir": 0
      },
      {
        "prefix": "Consolidated Net Profit ",
        "suffix": "Not Applicable: The company has declared_date for only one period",
        "dir": 0
      }
    ],
    "table": {
      "header": [
        "Dec'25",
        "Dec'24",
        "Change(%)"
      ],
      "body": [
        {
          "field": "Net Sales",
          "val1": "28.25",
          "val2": "17.36",
          "chgp": "62.73%",
          "chgp_class": "positive"
        },
        {
          "field": "Operating Profit (PBDIT) excl Other Income",
          "val1": "4.82",
          "val2": "2.41",
          "chgp": "100.00%",
          "chgp_class": "positive"
        },
        {
          "field": "Interest",
          "val1": "0.85",
          "val2": "1.49",
          "chgp": "-42.95%",
          "chgp_class": "positive"
        },
        {
          "field": "Exceptional Items",
          "val1": "0.00",
          "val2": "0.00",
          "chgp": "",
          "chgp_class": "neutral"
        },
        {
          "field": "Consolidate Net Profit",
          "val1": "2.22",
          "val2": "-0.32",
          "chgp": "793.75%",
          "chgp_class": "positive"
        },
        {
          "field": "Operating Profit Margin (Excl OI)",
          "val1": "17.06%",
          "val2": "13.88%",
          "chgp": "3.18%",
          "chgp_class": "positive"
        }
      ]
    }
  },
  {
    "link": "annual",
    "btn_text": "All Annual Results",
    "header": "Annual Results Snapshot (Consolidated) - Mar'26",
    "rhs": [
      {
        "prefix": "Net Sales ",
        "suffix": "YoY Growth in year ended Mar 2026 is 72.57% vs -0.12% in Mar 2025",
        "dir": 1
      },
      {
        "prefix": "Consolidated Net Profit ",
        "suffix": "YoY Growth in year ended Mar 2026 is 140.16% vs -3,434.78% in Mar 2025",
        "dir": 1
      }
    ],
    "table": {
      "header": [
        "Mar'26",
        "Mar'25",
        "Change(%)"
      ],
      "body": [
        {
          "field": "Net Sales",
          "val1": "43.35",
          "val2": "25.12",
          "chgp": "72.57%",
          "chgp_class": "positive"
        },
        {
          "field": "Operating Profit (PBDIT) excl Other Income",
          "val1": "4.77",
          "val2": "-3.87",
          "chgp": "223.26%",
          "chgp_class": "positive"
        },
        {
          "field": "Interest",
          "val1": "1.37",
          "val2": "2.07",
          "chgp": "-33.82%",
          "chgp_class": "positive"
        },
        {
          "field": "Exceptional Items",
          "val1": "0.00",
          "val2": "0.00",
          "chgp": "",
          "chgp_class": "neutral"
        },
        {
          "field": "Consolidate Net Profit",
          "val1": "3.08",
          "val2": "-7.67",
          "chgp": "140.16%",
          "chgp_class": "positive"
        },
        {
          "field": "Operating Profit Margin (Excl OI)",
          "val1": "11.00%",
          "val2": "-15.41%",
          "chgp": "26.41%",
          "chgp_class": "positive"
        }
      ]
    }
  }
]

Quarterly Results Snapshot (Consolidated) - Jun'26 - QoQstock-summary

Jun'26
Mar'26
Change(%)
Net Sales
14.85
15.10
-1.66%
Operating Profit (PBDIT) excl Other Income
1.50
0.43
248.84%
Interest
0.26
0.51
-49.02%
Exceptional Items
0.00
0.00
Consolidate Net Profit
0.70
1.35
-48.15%
Operating Profit Margin (Excl OI)
10.10%
2.85%
7.25%
Values in Rs Cr.
Direction Arrows
Net Sales

QoQ Growth in quarter ended Jun 2026 is -1.66% vs 104.33% in Mar 2026

Direction Arrows
Consolidated Net Profit

QoQ Growth in quarter ended Jun 2026 is -48.15% vs 117.74% in Mar 2026

Half Yearly Results Snapshot (Consolidated) - Sep'25stock-summary

Sep'25
Sep'24
Change(%)
Net Sales
20.86
11.78
77.08%
Operating Profit (PBDIT) excl Other Income
3.33
1.97
69.04%
Interest
0.59
0.90
-34.44%
Exceptional Items
0.00
0.00
Consolidate Net Profit
1.60
0.22
627.27%
Operating Profit Margin (Excl OI)
15.96%
16.72%
-0.76%
Values in Rs Cr.
Net Sales

Not Applicable: The company has declared_date for only one period

Consolidated Net Profit

Not Applicable: The company has declared_date for only one period

Nine Monthly Results Snapshot (Consolidated) - Dec'25stock-summary

Dec'25
Dec'24
Change(%)
Net Sales
28.25
17.36
62.73%
Operating Profit (PBDIT) excl Other Income
4.82
2.41
100.00%
Interest
0.85
1.49
-42.95%
Exceptional Items
0.00
0.00
Consolidate Net Profit
2.22
-0.32
793.75%
Operating Profit Margin (Excl OI)
17.06%
13.88%
3.18%
Values in Rs Cr.
Net Sales

Not Applicable: The company has declared_date for only one period

Consolidated Net Profit

Not Applicable: The company has declared_date for only one period

Annual Results Snapshot (Consolidated) - Mar'26stock-summary

Mar'26
Mar'25
Change(%)
Net Sales
43.35
25.12
72.57%
Operating Profit (PBDIT) excl Other Income
4.77
-3.87
223.26%
Interest
1.37
2.07
-33.82%
Exceptional Items
0.00
0.00
Consolidate Net Profit
3.08
-7.67
140.16%
Operating Profit Margin (Excl OI)
11.00%
-15.41%
26.41%
Values in Rs Cr.
Direction Arrows
Net Sales

YoY Growth in year ended Mar 2026 is 72.57% vs -0.12% in Mar 2025

Direction Arrows
Consolidated Net Profit

YoY Growth in year ended Mar 2026 is 140.16% vs -3,434.78% in Mar 2025

stock-summaryCompany CV
About Sampre Nutritions Ltd stock-summary
stock-summary
Sampre Nutritions Ltd
Micro Cap
FMCG
Sampre Nutritions Limited., incorporated in 1991 was promoted by The Gurbani Group, having its works at Medchal, in Andhra Pradesh. The Company is into the activity of manufacturing of Sugar Candies. The Company has been manufacturing candy products for its major customer, Cadbury India Ltd since August 1996. In 2000, it entered into agreement to manufacture "DAIRY MILK ECLAIRS".
Company Coordinates stock-summary
Company Details
P No 133 Indl Estate , Medchal Telangana : 501401
stock-summary
Tel: 91-08418-222427/28
stock-summary
gurbani@gurbanigroup.in
Registrar Details
Bigshare Services Pvt Ltd , 306, Right Wing, Amrutha Ville, Opp. Yasodha Hospital, Raj Bhavan Road, Somajiguda, Hyderabad