
Compare Samtex Fashion with Similar Stocks
Dashboard
With a Negative Book Value, the company has a Weak Long Term Fundamental Strength
- Poor long term growth as Net Sales has grown by an annual rate of % and Operating profit at 0% over the last 5 years
- The company has a negative book value of Rs 239.59 crore
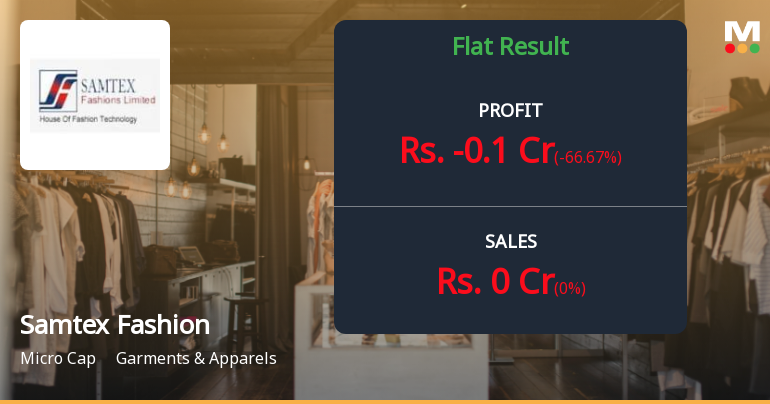
Flat results in Mar 26
Risky - Negative EBITDA
Underperformed the market in the last 1 year
Stock DNA
Garments & Apparels
INR 11 Cr (Micro Cap)
NA (Loss Making)
23
0.00%
-2.35
0.14%
-0.05
Total Returns (Price + Dividend) 
Samtex Fashion for the last several years.
Risk Adjusted Returns v/s
Returns Beta

News
Samtex Fashions Q4 FY26: Losses Deepen as Operations Remain Suspended
Samtex Fashions Ltd., a once-prominent name in India's garment manufacturing sector, reported a net loss of ₹0.10 crores for Q4 FY26, marking a 233.33% deterioration compared to the ₹0.03 crore loss in Q4 FY25. With zero revenue generation for multiple consecutive quarters and a market capitalisation that has shrunk to just ₹11.00 crores, the micro-cap company continues to struggle with operational paralysis. The stock closed at ₹1.40 on May 29, 2026, down 3.45% from the previous session, reflecting investor concerns about the company's non-existent business operations and mounting financial distress.
Read full news article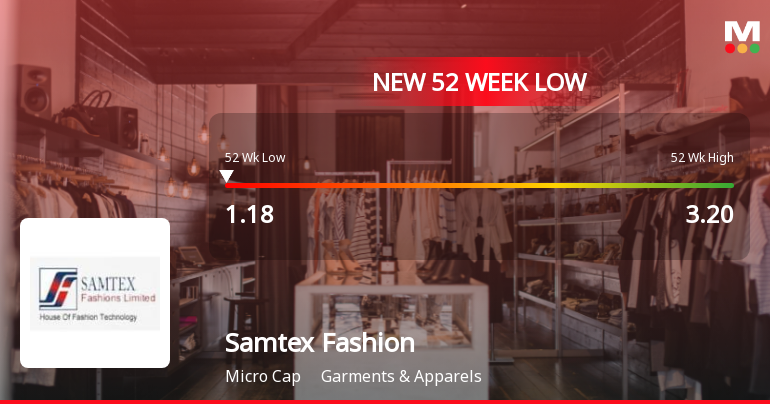
Markets Rally, But Samtex Fashions Ltd Sinks to 52-Week Low in Stock-Specific Sell-Off
While the broader market enjoyed a robust rally, Samtex Fashions Ltd plunged to a fresh 52-week low of Rs 1.05 on 1 Apr 2026, marking a steep decline of 59.42% over the past year and underscoring persistent headwinds for the micro-cap garment manufacturer.
Read full news article
Five Consecutive Losses Push Samtex Fashions Ltd to a New 52-Week Low
For the fifth consecutive session, Samtex Fashions Ltd has closed lower, slipping to a fresh 52-week low of Rs 1.12 on 30 Mar 2026. This decline comes amid broader market weakness, but the stock’s underperformance is notably sharper than its sector peers.
Read full news article Announcements
Compliances-Reg.24(A)-Annual Secretarial Compliance
30-May-2026 | Source : BSEAnnual Secretarial Compliance Report for the Year ended 31st March 2026
Announcement under Regulation 30 (LODR)-Newspaper Publication
29-May-2026 | Source : BSEPublication copy of Audited Standalone and Consolidated Financial Results for the Quarter and Year ended March 31 2026
Audited Financial Results (Standalone And Consolidated) For The Fourth Quarter And Year Ended 31St March 2026 Pursuant To Regulation 33 Of The SEBI (Listing Obligations And Disclosure Requirements) Regulations 2015
28-May-2026 | Source : BSEAudited Financial Results for the Quarter and year ended 31st March 2026 as per SEBI LODR Regulations 2015
Corporate Actions

No Upcoming Board Meetings

No Dividend history available

Samtex Fashions Ltd has announced 2:10 stock split, ex-date: 22 Sep 15

No Bonus history available

No Rights history available
Quality key factors
Valuation key factors
Technicals key factors
 Technical Indicator Scale: Bearish, Mildly Bearish, Sideways, Mildly Bullish, Bullish Turned
 Shareholding Snapshot : Mar 2026
Shareholding Compare (%holding)
Non Institution
24.4618
Held by 3 Schemes (0.07%)
Held by 0 FIIs
Rita Mittal (5.85%)
Gpm Spinning Mills Private Limited (4.7%)
31.06%
Quarterly Results Snapshot (Consolidated) - Mar'26 - QoQ
QoQ Growth in quarter ended Mar 2026 is 0.00% vs 0.00% in Dec 2025

QoQ Growth in quarter ended Mar 2026 is -66.67% vs 25.00% in Dec 2025
Half Yearly Results Snapshot (Consolidated) - Sep'25
Growth in half year ended Sep 2025 is 0.00% vs 0.00% in Sep 2024
Growth in half year ended Sep 2025 is -10.53% vs 93.19% in Sep 2024
Nine Monthly Results Snapshot (Consolidated) - Dec'25
YoY Growth in nine months ended Dec 2025 is 0.00% vs 0.00% in Dec 2024
YoY Growth in nine months ended Dec 2025 is 10.00% vs 91.62% in Dec 2024
Annual Results Snapshot (Consolidated) - Mar'26
YoY Growth in year ended Mar 2026 is 0.00% vs 0.00% in Mar 2025
YoY Growth in year ended Mar 2026 is 7.50% vs 91.61% in Mar 2025
About Samtex Fashions Ltd

Company Coordinates


