
Compare Sanblue Corp. with Similar Stocks
Dashboard
With a Operating Losses, the company has a Weak Long Term Fundamental Strength
- Poor long term growth as Operating profit has grown by an annual rate of 8.45%
Flat results in Mar 26
With ROE of 0.6, it has a Very Expensive valuation with a 0.5 Price to Book Value
Below par performance in long term as well as near term
Stock DNA
Garments & Apparels
INR 16 Cr (Micro Cap)
84.00
21
0.00%
0.00
0.55%
0.47
Total Returns (Price + Dividend) 
Sanblue Corp. for the last several years.
Risk Adjusted Returns v/s
Returns Beta

News
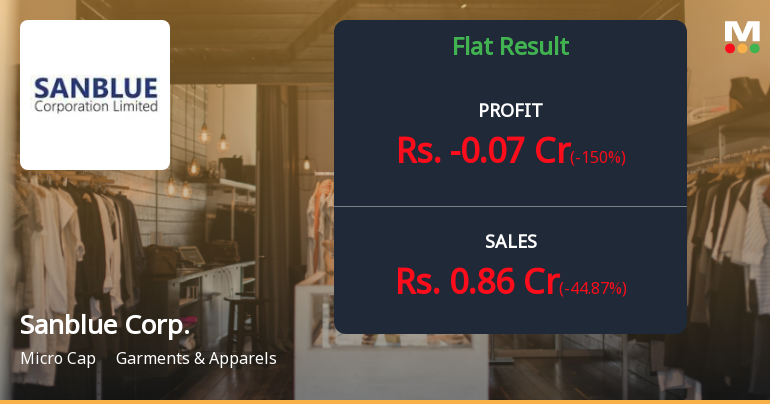
Sanblue Corporation Q4 FY26: Deepening Losses Signal Structural Distress
Sanblue Corporation Ltd., a micro-cap garments and apparels company, reported a concerning fourth-quarter performance for FY26, posting a net loss of ₹0.07 crores compared to a loss of ₹0.02 crores in the corresponding quarter last year. The stock has plunged 45.02% over the past year, significantly underperforming the Sensex's 8.40% decline, as investors flee the deteriorating fundamentals and persistent operational challenges. With a market capitalisation of just ₹18.00 crores, the company's inability to generate consistent profits despite sporadic revenue has raised serious questions about its viability.
Read full news articleWhen is the next results date for Sanblue Corporation Ltd?
The next results date for Sanblue Corporation Ltd is scheduled for 29 May 2026....
Read full news article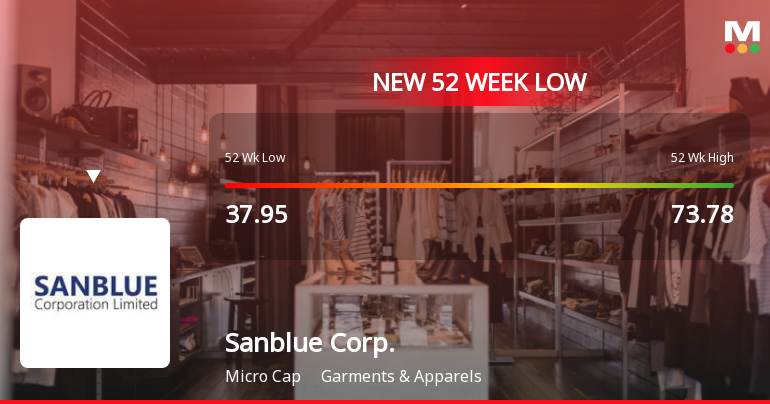
Five Consecutive Losses Push Sanblue Corporation Ltd to a New 52-Week Low
For the fifth straight session, Sanblue Corporation Ltd closed lower, breaching its 52-week low at Rs 28.64 on 6 Apr 2026. This marks a 17.06% decline over the past five trading days, underscoring sustained selling pressure on the micro-cap garment and apparel company.
Read full news article Announcements
Announcement under Regulation 30 (LODR)-Newspaper Publication
01-Jun-2026 | Source : BSENewspaper Publiction of Financial Results for the Quarter and Year ended 31/03/2026
Board Meeting Outcome for OUTCOME OF THE BOARD MEETING FOR THE QUARTER AND YEAR ENDED 31/03/2026
29-May-2026 | Source : BSEOUTCOME OF THE BOARD MEETING FOR THE YEAR AND QUARTER ENDED 31/03/2026
STATEMENT OF DEVIATION AND VARIATION FOR THE QUARTER AND YEAR ENDED 31/03/2026
29-May-2026 | Source : BSENOT APPLICABLE STAEMENT OF DEVIATION AND VARIATION FOR THE QUARTER AND YEAR ENDED 31/3/2026
Corporate Actions

No Upcoming Board Meetings

No Dividend history available

No Splits history available

No Bonus history available

No Rights history available
Quality key factors
Valuation key factors
Technicals key factors
 Technical Indicator Scale: Bearish, Mildly Bearish, Sideways, Mildly Bullish, Bullish Turned
 Shareholding Snapshot : Mar 2026
Shareholding Compare (%holding)
Promoters
None
Held by 0 Schemes
Held by 0 FIIs
Sanjiv Shah (59.65%)
Nitin K Patel (7.2%)
29.53%
Quarterly Results Snapshot (Standalone) - Mar'26 - QoQ

QoQ Growth in quarter ended Mar 2026 is -44.87% vs 290.00% in Dec 2025
QoQ Growth in quarter ended Mar 2026 is -150.00% vs -26.32% in Dec 2025
Half Yearly Results Snapshot (Standalone) - Sep'25
Growth in half year ended Sep 2025 is 0.00% vs 0.00% in Sep 2024
Growth in half year ended Sep 2025 is -36.84% vs 11.76% in Sep 2024
Nine Monthly Results Snapshot (Standalone) - Dec'25
YoY Growth in nine months ended Dec 2025 is 0.00% vs 0.00% in Dec 2024
YoY Growth in nine months ended Dec 2025 is -25.71% vs 25.00% in Dec 2024
Annual Results Snapshot (Standalone) - Mar'26

YoY Growth in year ended Mar 2026 is 91.02% vs 19.29% in Mar 2025
YoY Growth in year ended Mar 2026 is -42.42% vs 32.00% in Mar 2025
About Sanblue Corporation Ltd

Company Coordinates


