
Compare Sanco Industries with Similar Stocks
Dashboard
With a Negative Book Value, the company has a Weak Long Term Fundamental Strength
- Poor long term growth as Net Sales has grown by an annual rate of -100.00% and Operating profit at 0% over the last 5 years
- The company has a negative book value of Rs 6.12 crore
Flat results in Dec 25
Risky - Negative EBITDA
Below par performance in long term as well as near term
Stock DNA
Diversified consumer products
INR 4 Cr (Micro Cap)
NA (Loss Making)
36
0.00%
-9.07
7.03%
-0.63
Total Returns (Price + Dividend) 
Sanco Industries for the last several years.
Risk Adjusted Returns v/s
Returns Beta

News
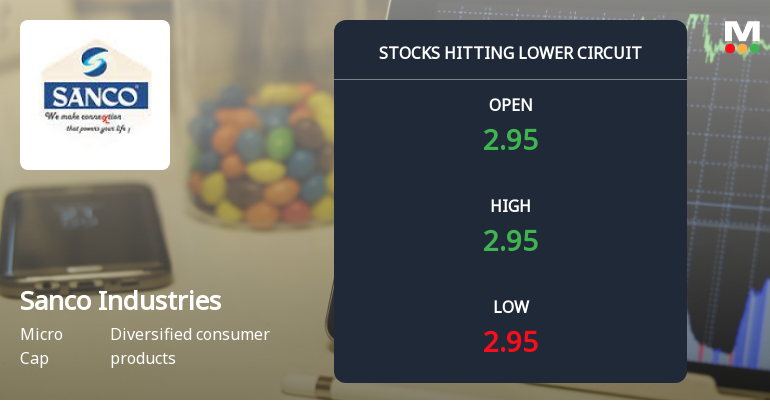
Sanco Industries Ltd Locks at Lower Circuit With 4.8% Loss — Sellers Queue, No Buyers in Sight
At Rs 2.95, sellers were still queuing — but there were no buyers willing to take the other side. Sanco Industries Ltd locked at its lower circuit of 4.84% on 2 Jun 2026, with unfilled sell orders and a frozen price.
Read full news article
Sanco Industries Ltd Locks at Lower Circuit With 4.9% Loss — Sellers Queue, No Buyers in Sight
At Rs 3.10, sellers were still queuing — but there were no buyers willing to take the other side. Sanco Industries Ltd locked at its lower circuit of 4.91% on 01 Jun 2026, with unfilled sell orders and a frozen price.
Read full news articleAre Sanco Industries Ltd latest results good or bad?
Sanco Industries Ltd's latest financial results for Q3 FY26 indicate a company facing significant operational challenges. The company reported zero net sales for multiple consecutive quarters, reflecting a complete cessation of business operations. In Q3 FY26, Sanco Industries incurred a net loss of ₹0.17 crores, which represents a notable increase in losses compared to the previous quarter's loss of ₹0.07 crores. This trend of mounting operational losses is concerning, especially given the absence of any revenue generation. The operating profit before depreciation, interest, and tax (PBDIT) also showed a negative figure of ₹0.15 crores, marking the worst quarterly performance in the available data series. Year-on-year comparisons reveal that the losses have expanded by 112.50% from the same quarter in the previous year, where the loss was ₹0.08 crores. The company's financial trajectory highlights a criti...
Read full news article Announcements
Sanco Industries Limited - Outcome of Board Meeting
14-Nov-2019 | Source : NSESanco Industries Limited has informed the Exchange regarding Board meeting held on November 13, 2019.
Sanco Industries Limited - Updates
01-Nov-2019 | Source : NSESanco Industries Limited has informed the Exchange regarding 'As per the letter attached.'.
Sanco Industries Limited - Outcome of Board Meeting
31-Oct-2019 | Source : NSESanco Industries Limited has informed the Exchange regarding Board meeting held on October 31, 2019.
Corporate Actions

No Upcoming Board Meetings

No Dividend history available

No Splits history available

Sanco Industries Ltd has announced 1:5 bonus issue, ex-date: 10 Aug 16

No Rights history available
Quality key factors
Valuation key factors
Technicals key factors
 Technical Indicator Scale: Bearish, Mildly Bearish, Sideways, Mildly Bullish, Bullish Turned
 Shareholding Snapshot : Mar 2026
Shareholding Compare (%holding)
Non Institution
None
Held by 0 Schemes
Held by 0 FIIs
Sanjay Gupta (13.63%)
Shubham Kumar (2.85%)
53.0%
Quarterly Results Snapshot (Standalone) - Dec'25 - YoY
YoY Growth in quarter ended Dec 2025 is 0.00% vs 0.00% in Dec 2024

YoY Growth in quarter ended Dec 2025 is -112.50% vs 50.00% in Dec 2024
Half Yearly Results Snapshot (Standalone) - Sep'25
Growth in half year ended Sep 2025 is 0.00% vs 0.00% in Sep 2024

Growth in half year ended Sep 2025 is 22.73% vs 18.52% in Sep 2024
Nine Monthly Results Snapshot (Standalone) - Dec'25
YoY Growth in nine months ended Dec 2025 is 0.00% vs 0.00% in Dec 2024
YoY Growth in nine months ended Dec 2025 is -13.33% vs 30.23% in Dec 2024
Annual Results Snapshot (Standalone) - Mar'25
YoY Growth in year ended Mar 2025 is 0.00% vs 0.00% in Mar 2024
YoY Growth in year ended Mar 2025 is 27.27% vs 34.52% in Mar 2024
About Sanco Industries Ltd

Company Coordinates


