
Compare Sandesh with Similar Stocks
Dashboard
Poor Management Efficiency with a low ROE of 8.82%
- The company has been able to generate a Return on Equity (avg) of 8.82% signifying low profitability per unit of shareholders funds
Poor long term growth as Operating profit has grown by an annual rate -58.82% of over the last 5 years
Flat results in Mar 26
Despite the size of the company, domestic mutual funds hold only 0% of the company
Below par performance in long term as well as near term
Stock DNA
Media & Entertainment
INR 737 Cr (Micro Cap)
11.00
13
0.26%
0.00
0.00%
0.52
Total Returns (Price + Dividend) 
Latest dividend: 2.5 per share ex-dividend date: Aug-22-2025
Risk Adjusted Returns v/s
Returns Beta

News
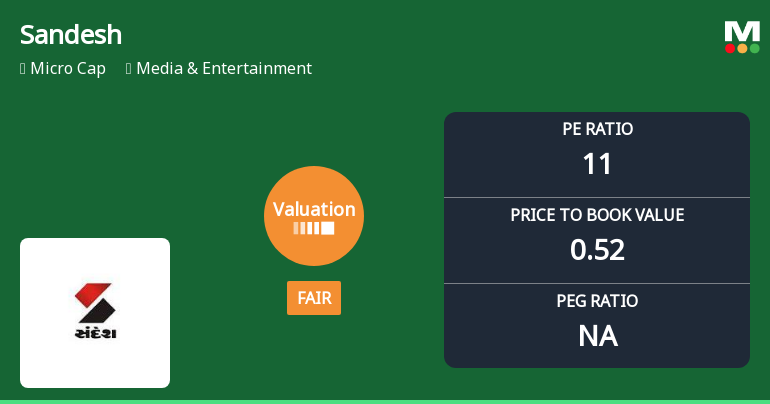
Sandesh Ltd. Valuation Shifts to Fair Amid Mixed Market Performance
Sandesh Ltd., a micro-cap player in the Media & Entertainment sector, has seen its valuation grade move from attractive to fair, reflecting a notable shift in price attractiveness. With a current P/E ratio of 10.99 and a price-to-book value of 0.52, the company’s valuation metrics now position it differently relative to its peers and historical benchmarks. This article analyses these changes in detail, placing them in the context of sector dynamics and broader market performance.
Read full news article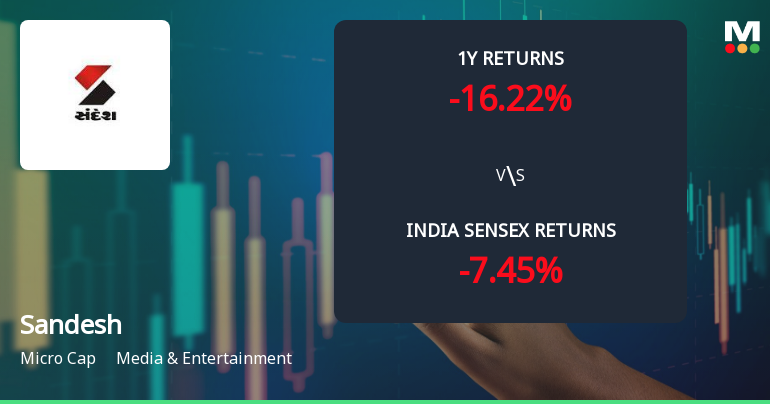
Sandesh Ltd. Technical Momentum Shifts Amid Mixed Market Signals
Sandesh Ltd., a micro-cap player in the Media & Entertainment sector, has exhibited a subtle shift in its technical momentum, moving from a bearish stance to a mildly bearish outlook. Despite a modest day gain of 1.28%, the stock’s technical indicators present a complex picture, reflecting both cautious optimism and persistent headwinds as it navigates volatile market conditions.
Read full news article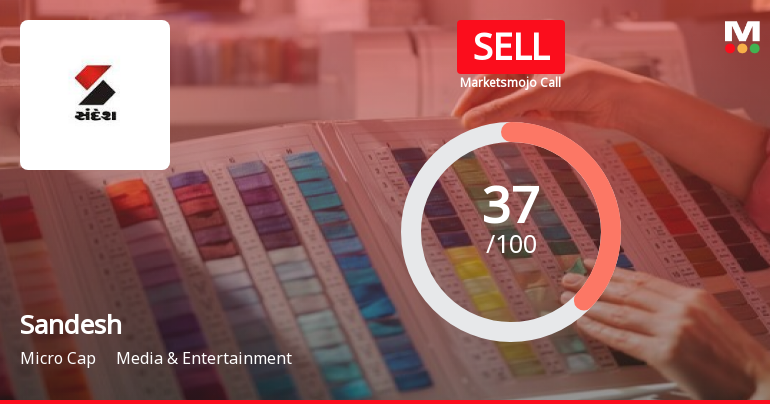
Sandesh Ltd. is Rated Sell
Sandesh Ltd. is rated 'Sell' by MarketsMOJO, with this rating last updated on 06 Feb 2026. However, the analysis and financial metrics discussed here reflect the company’s current position as of 24 July 2026, providing investors with an up-to-date view of its fundamentals, returns, and market standing.
Read full news article Announcements
Compliances-Certificate under Reg. 74 (5) of SEBI (DP) Regulations 2018
07-Jul-2026 | Source : BSECertificate under Reg. 7495) of SEBI (DP) Regulations 2018
Closure of Trading Window
30-Jun-2026 | Source : BSEClosure of Trading Window
Results - Financial Results For The Quarter And Financial Year March 31 2026.
22-Jun-2026 | Source : BSEResults - Financial Results for the quarter and financial year March 31 2026
Corporate Actions

No Upcoming Board Meetings

Sandesh Ltd. has declared 25% dividend, ex-date: 22 Aug 25

No Splits history available

No Bonus history available

No Rights history available
Quality key factors
Valuation key factors
Technicals key factors
 Technical Indicator Scale: Bearish, Mildly Bearish, Sideways, Mildly Bullish, Bullish Turned
 Shareholding Snapshot : Jun 2026
Shareholding Compare (%holding)
Promoters
None
Held by 0 Schemes
Held by 7 FIIs (0.09%)
Satyesh Prochem Llp (41.83%)
Zora Traders Limited (4.53%)
12.24%
Quarterly Results Snapshot (Consolidated) - Mar'26 - QoQ

QoQ Growth in quarter ended Mar 2026 is 173.68% vs -0.96% in Dec 2025

QoQ Growth in quarter ended Mar 2026 is -189.76% vs 896.89% in Dec 2025
Half Yearly Results Snapshot (Consolidated) - Sep'25
Growth in half year ended Sep 2025 is 8.61% vs -3.94% in Sep 2024
Growth in half year ended Sep 2025 is -30.20% vs 50.36% in Sep 2024
Nine Monthly Results Snapshot (Consolidated) - Dec'25
YoY Growth in nine months ended Dec 2025 is 4.46% vs -7.42% in Dec 2024
YoY Growth in nine months ended Dec 2025 is 47.86% vs -41.81% in Dec 2024
Annual Results Snapshot (Consolidated) - Mar'26
YoY Growth in year ended Mar 2026 is 49.47% vs -8.67% in Mar 2025
YoY Growth in year ended Mar 2026 is -14.63% vs -59.11% in Mar 2025
About Sandesh Ltd.

Company Coordinates


