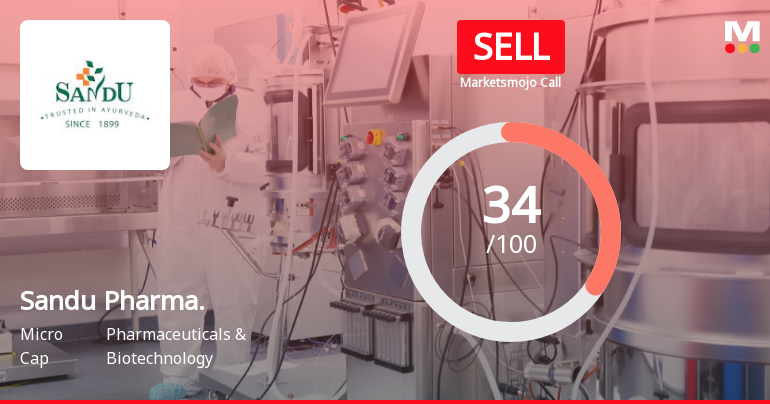
Sandu Pharma.

  • Market Cap: Micro Cap
  • Industry: Pharmaceuticals & Biotechnology
  • ISIN: INE751D01014
  • NSEID:
  • BSEID: 524703
INR
38.16
-1.46 (-3.69%)
BSENSE

Jul 17, 03:30 PM

BSE+NSE Vol: 696

  • Price Points
  • Score
  • Mojo Parameters
  • Total Return
  • News and Corporate Actions
  • Key factors
  • Shareholding
  • Financials
  • CompanyCV
stock-summaryPrice Point
High/Low

1Day

52 Week

Valuation
Technical
Day's Volume

CASH

696 (65.01%) Volume

Shareholding (Jun 2026)

FII

0.00%

Held by 0 FIIs

DII

0.01%

Held by 0 DIIs

Promoter

37.79%

Which are the latest news on Sandu Pharma.?

19-Jul-2026

Why is Sandu Pharmaceuticals Ltd falling/rising?

19-Jul-2026

As of 19-Jul, Sandu Pharmaceuticals Ltd's stock price is at 38.16, reflecting a significant decline over various periods, including a 23.85% drop in the past year. The stock's poor performance, coupled with decreasing investor participation, indicates a negative trend overshadowing any short-term gains.

As of 19-Jul, Sandu Pharmaceuticals Ltd's stock price is falling, currently at 38.16, which represents a decrease of 1.46 or 3.69%. The stock has underperformed significantly over various time periods, with a 1-week decline of 6.93% and a 1-month decline of 11.05%, while the benchmark Sensex has shown positive returns during these periods. Over the past year, the stock has decreased by 23.85%, contrasting with the Sensex's decline of only 4.99%. Additionally, the stock has shown a substantial drop of 28.31% over the past three years, while the Sensex has increased by 17.36%.<BR><BR>Today's performance indicates that the stock has outperformed its sector by 2.63%, but this is overshadowed by the overall negative trend. The moving averages reveal that the stock is higher than the 100-day and 200-day averages but lower than the 5-day, 20-day, and 50-day averages, suggesting a short-term weakness. Furthermore, there has been a notable decline in investor participation, with delivery volume on 16 July falling by 64.52% compared to the 5-day average. This decline in trading activity may indicate waning investor interest, contributing to the stock's downward movement. Overall, the combination of poor performance relative to the market, declining investor participation, and negative trends in stock returns are key factors driving the stock price down.

View full answer

How big is Sandu Pharma.?

11-Jun-2026

As of 10th June, Sandu Pharmaceuticals Ltd has a market capitalization of 41.00 Cr, with recent net sales of 67.19 Cr and a net profit of 1.56 Cr. The company has shareholder's funds of 42.02 Cr and total assets of 55.72 Cr.

As of 10th June, Sandu Pharmaceuticals Ltd has a market capitalization of 41.00 Cr, categorizing it as a Micro Cap company.<BR><BR>In the latest four quarters, Sandu Pharmaceuticals reported Net Sales of 67.19 Cr and a Net Profit of 1.56 Cr.<BR><BR>For the reporting period of March 2025, the company has Shareholder's Funds amounting to 42.02 Cr and Total Assets of 55.72 Cr.

View full answer

Who are in the management team of Sandu Pharma.?

11-Jun-2026

The management team of Sandu Pharma includes Umesh B Sandu (Managing Director), Pratika Mhambray (Company Secretary), and several Non-Executive Directors: Dilip R Salgaocar, Krishna B Deshpande, Madan Laxman Kapre, K Vinay Kumar, Shashank B Sandu, and Shubhada P Sandu. This team combines executive leadership with independent oversight.

The management team of Sandu Pharma includes the following individuals:<BR><BR>1. **Umesh B Sandu** - Managing Director<BR>2. **Pratika Mhambray** - Company Secretary & Compliance Officer<BR>3. **Dilip R Salgaocar** - Non-Executive & Independent Director<BR>4. **Krishna B Deshpande** - Non-Executive & Independent Director<BR>5. **Madan Laxman Kapre** - Non-Executive & Independent Director<BR>6. **K Vinay Kumar** - Non-Executive & Independent Director<BR>7. **Shashank B Sandu** - Non-Executive & Non-Independent Director<BR>8. **Shubhada P Sandu** - Non-Executive & Non-Independent Director<BR><BR>This team brings a mix of executive and independent oversight to the company.

View full answer

Who are the peers of the Sandu Pharma.?

11-Jun-2026

Sandu Pharma's peers include Veerhealth Care, Mangalam Drugs, Rajnish Wellness, Vista Pharma, Murae Organisor, Lasa Supergeneri, Roopa Industries, ANG Lifesciences, and Medi Caps. Most peers exhibit below-average management risk and growth, with Veerhealth Care showing the highest 1-year return at 39.82% and Mangalam Drugs the lowest at -65.43%.

Peers: The peers of Sandu Pharma are Veerhealth Care, Mangalam Drugs, Rajnish Wellness, Vista Pharma, Murae Organisor, Lasa Supergeneri, Roopa Industries, ANG Lifesciences, and Medi Caps.<BR><BR>Quality Snapshot: Below Average management risk is observed at all peers, including Veerhealth Care, Mangalam Drugs, Rajnish Wellness, Vista Pharma, Murae Organisor, Lasa Supergeneri, Roopa Industries, ANG Lifesciences, and Medi Caps. Average growth is found at Sandu Pharma and Rajnish Wellness, while Below Average growth is noted for Mangalam Drugs, Vista Pharma, Lasa Supergeneri, ANG Lifesciences, and Medi Caps, with Good growth at Murae Organisor and Excellent growth at Roopa Industries. Sandu Pharma and Medi Caps have a Good capital structure, while the rest have Below Average capital structure.<BR><BR>Return Snapshot: Veerhealth Care has the highest 1-year return at 39.82%, while Mangalam Drugs has the lowest at -65.43%, with Sandu Pharma's 1-year return at -21.83% being significantly lower than Veerhealth Care's but higher than Mangalam Drugs'. Additionally, several peers, including Murae Organisor, Lasa Supergeneri, and Medi Caps, have negative six-month returns.

View full answer

What does Sandu Pharma. do?

10-Jun-2026

Sandu Pharmaceuticals Ltd manufactures and trades Ayurvedic medicines, operating as a Micro Cap company since its establishment in 1985. As of March 2026, it reported net sales of 17 Cr and a market cap of INR 41 Cr.

Overview:<BR>Sandu Pharmaceuticals Ltd is engaged in the manufacturing and trading of Ayurvedic medicines and operates within the Pharmaceuticals & Biotechnology industry, classified as a Micro Cap company.<BR><BR>History:<BR>Established in 1985, Sandu Pharmaceuticals Ltd has been involved in the Ayurvedic medicine sector since its inception. The company went public in September 1994, issuing 17.70 lac equity shares to finance a new project in Goa. The latest reported quarter for sales and profit is March 2026.<BR><BR>Financial Snapshot:<BR>Net Sales: 17 Cr (Quarterly Results - Mar 2026)<BR>Net Profit: 0 Cr (Quarterly Results - Mar 2026)<BR>Market-cap: INR 41 Cr (Micro Cap)<BR><BR>Key Metrics:<BR>P/E: 25.00<BR>Industry P/E: 21<BR>Dividend Yield: 1.90%<BR>Debt Equity: -0.05<BR>Return on Equity: 3.71%<BR>Price to Book: 0.97<BR><BR>Contact Details:<BR>Address: Plot No 25/26/29 & 30, Pilerne Indl Estate Marra Bard Bardez Goa : 403511<BR>Website: http://www.sandu.in

View full answer

Should I buy, sell or hold Sandu Pharmaceuticals Ltd?

03-Jun-2026

When is the next results date for Sandu Pharmaceuticals Ltd?

28-Apr-2026

The next results date for Sandu Pharmaceuticals Ltd is 05 May 2026.

The next results date for Sandu Pharmaceuticals Ltd is scheduled for 05 May 2026.

View full answer

Is Sandu Pharma. overvalued or undervalued?

24-Nov-2025

As of November 21, 2025, Sandu Pharma is considered undervalued with an attractive valuation grade, featuring a PE ratio of 24.77, an EV to EBITDA of 13.26, and a Price to Book Value of 0.92, significantly lower than its peers, despite a year-to-date stock decline of 30.14% compared to the Sensex's gain of 9.08%.

As of 21 November 2025, the valuation grade for Sandu Pharma has moved from fair to attractive, indicating a positive shift in its valuation outlook. The company is currently assessed as undervalued based on its financial metrics. Key ratios include a PE ratio of 24.77, an EV to EBITDA of 13.26, and a Price to Book Value of 0.92, which suggest that the stock is trading at a reasonable valuation compared to its earnings and asset base.<BR><BR>In comparison to its peers, Sandu Pharma's PE ratio is significantly lower than that of Elitecon International, which stands at 239.98, and MMTC, which has a PE of 133.45. This positions Sandu Pharma favorably within the pharmaceuticals and biotechnology sector, especially when considering its attractive valuation grade. Notably, the company's recent stock performance has lagged behind the Sensex, with a year-to-date decline of 30.14% compared to the Sensex's gain of 9.08%, further reinforcing the notion that it may be undervalued in the current market environment.

View full answer

How has been the historical performance of Sandu Pharma.?

13-Nov-2025

Sandu Pharma has shown stable financial performance, with net sales slightly decreasing from 67.28 Cr in Mar'24 to 67.19 Cr in Mar'25, while operating profit and profit after tax increased modestly. Total assets rose from 52.41 Cr to 55.72 Cr, indicating consistent asset management.

Answer:<BR>The historical performance of Sandu Pharma shows a relatively stable financial trajectory over the past few years.<BR><BR>Breakdown:<BR>Sandu Pharma's net sales have remained consistent, with a slight decrease from 67.28 Cr in Mar'24 to 67.19 Cr in Mar'25, following a gradual increase from 65.35 Cr in Mar'23 and 65.50 Cr in Mar'22. The total operating income mirrored this trend, reflecting the same figures as net sales. The total expenditure, excluding depreciation, decreased slightly from 64.99 Cr in Mar'24 to 64.43 Cr in Mar'25, contributing to an operating profit (PBDIT) increase from 2.71 Cr to 2.93 Cr during the same period. Profit before tax also saw a modest rise from 2.07 Cr in Mar'24 to 2.16 Cr in Mar'25, while profit after tax increased from 1.46 Cr to 1.55 Cr. The earnings per share (EPS) improved from 1.51 in Mar'24 to 1.6 in Mar'25, although it has decreased from 1.8 in Mar'22. On the balance sheet, total assets rose from 52.41 Cr in Mar'24 to 55.72 Cr in Mar'25, with total liabilities also increasing from 52.41 Cr to 55.72 Cr. The cash flow results indicate a stable cash position, with closing cash and cash equivalents remaining at 1.00 Cr for both Mar'25 and Mar'24. Overall, Sandu Pharma has demonstrated steady performance with slight fluctuations in profitability and consistent asset management.

View full answer

Are Sandu Pharma. latest results good or bad?

13-Aug-2025

Sandu Pharmaceuticals' latest results are unfavorable, with a 18.1% decline in net sales and a 41.07% drop in net profit for the quarter ending March 2025, leading to a 'Strong Sell' rating from MarketsMOJO due to serious financial concerns.

The latest results for Sandu Pharmaceuticals indicate a challenging financial performance. For the quarter ending March 2025, the company reported net sales of Rs 14.07 crore, which is a significant decline of 18.1% compared to the average net sales of Rs 17.18 crore over the previous four quarters. This figure represents the lowest net sales for Sandu Pharmaceuticals in the last five quarters.<BR><BR>Additionally, the company's consolidated net profit saw a sharp decrease of 41.07%, reflecting ongoing difficulties in maintaining profitability. The operating profit also experienced a decline of 54.55%. Given these results, MarketsMOJO has issued a 'Strong Sell' rating for the company, indicating serious concerns about its financial health and future prospects.<BR><BR>Overall, the financial results suggest that Sandu Pharmaceuticals is facing significant challenges, making the latest performance appear unfavorable.

View full answer

What is the technical trend for Sandu Pharma.?

09-Jun-2025

As of June 5, 2025, Sandu Pharma's technical trend is mildly bearish, with mixed signals from indicators like the weekly MACD being mildly bullish and the monthly MACD remaining bearish, alongside bearish weekly RSI and daily moving averages.

As of 5 June 2025, the technical trend for Sandu Pharma has changed from bearish to mildly bearish. The weekly MACD is mildly bullish, but the monthly MACD remains bearish, indicating mixed signals. The weekly RSI is bearish, while the monthly RSI shows no signal, suggesting weakness in momentum. Moving averages on the daily chart are mildly bearish, reinforcing the negative sentiment. Bollinger Bands indicate a mildly bullish stance on the weekly but bearish on the monthly, adding to the mixed outlook. The KST is mildly bullish weekly but bearish monthly, and Dow Theory shows a mildly bearish trend on the weekly with no trend on the monthly. Overall, the current stance is mildly bearish, with key indicators like the daily moving averages and the monthly MACD contributing to this view.

View full answer

Who are the top shareholders of the Sandu Pharma.?

06-Jun-2025

The top shareholders of Sandu Pharma are Umesh Bhaskar Sandu with 14.37%, and Sanmark Realty And Finance Private Limited with 5.63%. Individual investors collectively own 35.9% of the shares, with no institutional or mutual fund holdings.

The top shareholders of Sandu Pharma include Umesh Bhaskar Sandu, who holds the highest promoter stake at 14.37%. Additionally, Sanmark Realty And Finance Private Limited is the largest public shareholder with a holding of 5.63%. Individual investors collectively hold 35.9% of the shares. There are no institutional investors or mutual funds currently holding shares in the company.

View full answer

Has Sandu Pharma. declared dividend?

06-Jun-2025

Sandu Pharmaceuticals Ltd has declared an 8% dividend, amounting to ₹0.80 per share, with an ex-date of September 19, 2024. While recent total returns show declines over shorter periods, the company has experienced substantial gains over the longer term.

Sandu Pharmaceuticals Ltd has declared an 8% dividend.<BR><BR>Dividend Details:<BR>- Percentage announced: 8%<BR>- Amount per share: ₹0.80<BR>- Ex-date: 19 Sep 2024<BR><BR>Dividend Yield: 1.55%.<BR><BR>Total Returns by Period:<BR>Over the 6-month period, the price return was -12.48%, with a dividend return of 0%, resulting in a total return of -12.48%.<BR><BR>In the 1-year period, the price return was -16.07%, the dividend return was 1.34%, leading to a total return of -14.73%.<BR><BR>For the 2-year period, the price return was -11.88%, the dividend return was 2.55%, culminating in a total return of -9.33%.<BR><BR>During the 3-year period, the price return was -25.96%, with a dividend return of 3.55%, resulting in a total return of -22.41%.<BR><BR>In the 4-year period, the price return was 25.8%, the dividend return was 4.83%, producing a total return of 30.63%.<BR><BR>Over the 5-year period, the price return was 220.0%, with a dividend return of 14.52%, leading to a total return of 234.52%.<BR><BR>Overall, Sandu Pharmaceuticals Ltd has declared a dividend, but the total returns over various periods show a mixed performance, with significant declines in shorter periods and substantial gains over the longer term. The recent dividend declaration may provide some relief to investors amidst the fluctuating returns.

View full answer
iScoreScore
Click here to find our call on this stock
Strong Sell
Sell
Hold
Buy
Strong Buy

Dashboard

1

Weak Long Term Fundamental Strength with an average Return on Equity (ROE) of 3.73%

  • Poor long term growth as Net Sales has grown by an annual rate of 3.54% and Operating profit at 7.49% over the last 5 years
  • Company's ability to service its debt is weak with a poor EBIT to Interest (avg) ratio of 1.92
2

Flat results in Mar 25

3

Consistent Underperformance against the benchmark over the last 3 years

stock-summaryMojo Parameters

Mojo Parameters

Loading Valuation Snapshot...

Stock DNA

stock-summary
Industry

Pharmaceuticals & Biotechnology

stock-summary
Market cap

INR 40 Cr (Micro Cap)

stock-summary
P/E

25.00

stock-summary
Industry P/E

23

stock-summary
Dividend Yield

2.02%

stock-summary
Debt Equity

-0.05

stock-summary
Return on Equity

3.71%

stock-summary
Price to Book

0.91

Revenue and Profits:
Net Sales:
17 Cr
(Quarterly Results - Mar 2026)
Net Profit:
0 Cr
stock-summaryTotal Returns
Total Returns (Price + Dividend) stock-summary
Dividend Yield (2.02%)
TimePeriod
Price Return
Dividend Return
Total Return
3 Months
-0.75%
0%
-0.75%
6 Months
-3.39%
0%
-3.39%
1 Year
-23.85%
1.71%
-22.14%
2 Years
-39.96%
2.67%
-37.29%
3 Years
-28.31%
4.25%
-24.06%
4 Years
-41.29%
4.47%
-36.82%
5 Years
-32.34%
6.53%
-25.81%

Latest dividend: 0.7999999999999999 per share ex-dividend date: Sep-18-2025

Risk Adjusted Returns v/s stock-summary
Returns Beta
Icon
Beta has not been calculated since enough price history is not available
stock-summaryNews & Corporate Actions

Announcements stock-summary

Announcement Under Regulation 30-Reconstitution Of Committees Of Board-Audit/Nomination/Stakeholders

11-Jul-2026 | Source : BSE

Reconstitution of Committees of Board-Audit/Nomination/Stakeholders

Board Meeting Outcome for Outcome Of The Board Meeting Dated 11.07.2026

11-Jul-2026 | Source : BSE

Outcome of the Board Meeting dated 11.07.2026

Announcement under Regulation 30 (LODR)-Change in Directorate

11-Jul-2026 | Source : BSE

1.Appointment of Dr Neeti Madan Kapre (DIN:06801264) as additional Non Executive Independent Director of the Company 2.Redesignation of Shri Balram Viswanathan (DIN: 10245195) as Chairman and Managing Director of the Company

Corporate Actions stock-summary

stock-summary
BOARD MEETING

No Upcoming Board Meetings

stock-summary
DIVIDEND

Sandu Pharmaceuticals Ltd has declared 8% dividend, ex-date: 18 Sep 25

stock-summary
SPLITS

No Splits history available

stock-summary
BONUS

No Bonus history available

stock-summary
RIGHTS

No Rights history available

stock-summaryKey Factors

Quality key factors stock-summary

Factor
Value
Sales Growth (5y)
3.54%
EBIT Growth (5y)
7.49%
EBIT to Interest (avg)
1.92
Debt to EBITDA (avg)
0.14
Net Debt to Equity (avg)
-0.05
Sales to Capital Employed (avg)
1.63
Tax Ratio
27.91%
Dividend Payout Ratio
49.90%
Pledged Shares
0
Institutional Holding
0.01%
ROCE (avg)
4.94%
ROE (avg)
3.73%

Valuation key factors

Factor
Value
P/E Ratio
25
Industry P/E
23
Price to Book Value
0.93
EV to EBIT
17.71
EV to EBITDA
13.39
EV to Capital Employed
0.92
EV to Sales
0.55
PEG Ratio
1.95
Dividend Yield
1.98%
ROCE (Latest)
5.22%
ROE (Latest)
3.71%

Technicals key factors

Indicator
Weekly
Monthly
MACD
Bullish
Mildly Bullish
RSI
No Signal
Bearish
Bollinger Bands
Mildly Bullish
Bearish
Moving Averages
Mildly Bullish (Daily)
KST
Bullish
Bearish
Dow Theory
Mildly Bearish
Mildly Bullish
stock-summary Technical Indicator Scale: Bearish, Mildly Bearish, Sideways, Mildly Bullish, Bullish  Turned 
stock-summaryShareholding
Shareholding Snapshot : Jun 2026stock-summary
Shareholding Compare (%holding) stock-summary
Majority shareholders

Non Institution

Pledged Promoter Holdings

None

Mutual Funds

Held by 0 Schemes

FIIs

Held by 0 FIIs

Promoter with highest holding

Umesh Bhaskar Sandu (14.37%)

Highest Public shareholder

Sanmark Realty And Finance Private Limited (5.63%)

Individual Investors Holdings

37.02%

stock-summaryFinancial
[
  {
    "link": "quarterly",
    "btn_text": "All Quarterly Results",
    "header": "Quarterly Results Snapshot (Standalone) - Mar'26 - QoQ",
    "rhs": [
      {
        "prefix": "Net Sales ",
        "suffix": "QoQ Growth in quarter ended Mar 2026 is -10.18% vs 6.47% in Dec 2025",
        "dir": -1
      },
      {
        "prefix": "Standalone Net Profit ",
        "suffix": "QoQ Growth in quarter ended Mar 2026 is -95.92% vs 88.46% in Dec 2025",
        "dir": -1
      }
    ],
    "table": {
      "header": [
        "Mar'26",
        "Dec'25",
        "Change(%)"
      ],
      "body": [
        {
          "field": "Net Sales",
          "val1": "16.85",
          "val2": "18.76",
          "chgp": "-10.18%",
          "chgp_class": "negative"
        },
        {
          "field": "Operating Profit (PBDIT) excl Other Income",
          "val1": "0.56",
          "val2": "1.04",
          "chgp": "-46.15%",
          "chgp_class": "negative"
        },
        {
          "field": "Interest",
          "val1": "0.03",
          "val2": "0.03",
          "chgp": "",
          "chgp_class": "neutral"
        },
        {
          "field": "Exceptional Items",
          "val1": "0.00",
          "val2": "0.00",
          "chgp": "",
          "chgp_class": "neutral"
        },
        {
          "field": "Standalone Net Profit",
          "val1": "0.04",
          "val2": "0.98",
          "chgp": "-95.92%",
          "chgp_class": "negative"
        },
        {
          "field": "Operating Profit Margin (Excl OI)",
          "val1": "3.32%",
          "val2": "5.54%",
          "chgp": "-2.22%",
          "chgp_class": "negative"
        }
      ]
    }
  },
  {
    "link": "half-yearly",
    "btn_text": "All Half Yearly Results",
    "header": "Half Yearly Results Snapshot (Standalone) - Sep'25",
    "rhs": [
      {
        "prefix": "Net Sales ",
        "suffix": " Growth in half year ended Sep 2025 is -1.24% vs 1.43% in Sep 2024",
        "dir": -1
      },
      {
        "prefix": "Standalone Net Profit ",
        "suffix": " Growth in half year ended Sep 2025 is 11.94% vs 1.52% in Sep 2024",
        "dir": 1
      }
    ],
    "table": {
      "header": [
        "Sep'25",
        "Sep'24",
        "Change(%)"
      ],
      "body": [
        {
          "field": "Net Sales",
          "val1": "34.32",
          "val2": "34.75",
          "chgp": "-1.24%",
          "chgp_class": "negative"
        },
        {
          "field": "Operating Profit (PBDIT) excl Other Income",
          "val1": "1.39",
          "val2": "1.32",
          "chgp": "5.30%",
          "chgp_class": "positive"
        },
        {
          "field": "Interest",
          "val1": "0.05",
          "val2": "0.05",
          "chgp": "",
          "chgp_class": "neutral"
        },
        {
          "field": "Exceptional Items",
          "val1": "0.00",
          "val2": "0.00",
          "chgp": "",
          "chgp_class": "neutral"
        },
        {
          "field": "Standalone Net Profit",
          "val1": "0.75",
          "val2": "0.67",
          "chgp": "11.94%",
          "chgp_class": "positive"
        },
        {
          "field": "Operating Profit Margin (Excl OI)",
          "val1": "4.05%",
          "val2": "3.80%",
          "chgp": "0.25%",
          "chgp_class": "positive"
        }
      ]
    }
  },
  {
    "link": "nine-monthly",
    "btn_text": "All Nine Monthly Results",
    "header": "Nine Monthly Results Snapshot (Standalone) - Dec'25",
    "rhs": [
      {
        "prefix": "Net Sales ",
        "suffix": "YoY Growth in nine months ended Dec 2025 is -0.08% vs 2.77% in Dec 2024",
        "dir": -1
      },
      {
        "prefix": "Standalone Net Profit ",
        "suffix": "YoY Growth in nine months ended Dec 2025 is 40.65% vs 41.38% in Dec 2024",
        "dir": -1
      }
    ],
    "table": {
      "header": [
        "Dec'25",
        "Dec'24",
        "Change(%)"
      ],
      "body": [
        {
          "field": "Net Sales",
          "val1": "53.08",
          "val2": "53.12",
          "chgp": "-0.08%",
          "chgp_class": "negative"
        },
        {
          "field": "Operating Profit (PBDIT) excl Other Income",
          "val1": "2.43",
          "val2": "2.31",
          "chgp": "5.19%",
          "chgp_class": "positive"
        },
        {
          "field": "Interest",
          "val1": "0.08",
          "val2": "0.08",
          "chgp": "",
          "chgp_class": "neutral"
        },
        {
          "field": "Exceptional Items",
          "val1": "0.00",
          "val2": "0.00",
          "chgp": "",
          "chgp_class": "neutral"
        },
        {
          "field": "Standalone Net Profit",
          "val1": "1.73",
          "val2": "1.23",
          "chgp": "40.65%",
          "chgp_class": "positive"
        },
        {
          "field": "Operating Profit Margin (Excl OI)",
          "val1": "4.58%",
          "val2": "4.35%",
          "chgp": "0.23%",
          "chgp_class": "positive"
        }
      ]
    }
  },
  {
    "link": "annual",
    "btn_text": "All Annual Results",
    "header": "Annual Results Snapshot (Standalone) - Mar'26",
    "rhs": [
      {
        "prefix": "Net Sales ",
        "suffix": "YoY Growth in year ended Mar 2026 is 4.08% vs -0.13% in Mar 2025",
        "dir": 1
      },
      {
        "prefix": "Standalone Net Profit ",
        "suffix": "YoY Growth in year ended Mar 2026 is 14.19% vs 6.16% in Mar 2025",
        "dir": 1
      }
    ],
    "table": {
      "header": [
        "Mar'26",
        "Mar'25",
        "Change(%)"
      ],
      "body": [
        {
          "field": "Net Sales",
          "val1": "69.93",
          "val2": "67.19",
          "chgp": "4.08%",
          "chgp_class": "positive"
        },
        {
          "field": "Operating Profit (PBDIT) excl Other Income",
          "val1": "3.00",
          "val2": "2.76",
          "chgp": "8.70%",
          "chgp_class": "positive"
        },
        {
          "field": "Interest",
          "val1": "0.11",
          "val2": "0.10",
          "chgp": "10.00%",
          "chgp_class": "negative"
        },
        {
          "field": "Exceptional Items",
          "val1": "0.00",
          "val2": "0.00",
          "chgp": "",
          "chgp_class": "neutral"
        },
        {
          "field": "Standalone Net Profit",
          "val1": "1.77",
          "val2": "1.55",
          "chgp": "14.19%",
          "chgp_class": "positive"
        },
        {
          "field": "Operating Profit Margin (Excl OI)",
          "val1": "4.29%",
          "val2": "4.11%",
          "chgp": "0.18%",
          "chgp_class": "positive"
        }
      ]
    }
  }
]

Quarterly Results Snapshot (Standalone) - Mar'26 - QoQstock-summary

Mar'26
Dec'25
Change(%)
Net Sales
16.85
18.76
-10.18%
Operating Profit (PBDIT) excl Other Income
0.56
1.04
-46.15%
Interest
0.03
0.03
Exceptional Items
0.00
0.00
Standalone Net Profit
0.04
0.98
-95.92%
Operating Profit Margin (Excl OI)
3.32%
5.54%
-2.22%
Values in Rs Cr.
Direction Arrows
Net Sales

QoQ Growth in quarter ended Mar 2026 is -10.18% vs 6.47% in Dec 2025

Direction Arrows
Standalone Net Profit

QoQ Growth in quarter ended Mar 2026 is -95.92% vs 88.46% in Dec 2025

Half Yearly Results Snapshot (Standalone) - Sep'25stock-summary

Sep'25
Sep'24
Change(%)
Net Sales
34.32
34.75
-1.24%
Operating Profit (PBDIT) excl Other Income
1.39
1.32
5.30%
Interest
0.05
0.05
Exceptional Items
0.00
0.00
Standalone Net Profit
0.75
0.67
11.94%
Operating Profit Margin (Excl OI)
4.05%
3.80%
0.25%
Values in Rs Cr.
Direction Arrows
Net Sales

Growth in half year ended Sep 2025 is -1.24% vs 1.43% in Sep 2024

Direction Arrows
Standalone Net Profit

Growth in half year ended Sep 2025 is 11.94% vs 1.52% in Sep 2024

Nine Monthly Results Snapshot (Standalone) - Dec'25stock-summary

Dec'25
Dec'24
Change(%)
Net Sales
53.08
53.12
-0.08%
Operating Profit (PBDIT) excl Other Income
2.43
2.31
5.19%
Interest
0.08
0.08
Exceptional Items
0.00
0.00
Standalone Net Profit
1.73
1.23
40.65%
Operating Profit Margin (Excl OI)
4.58%
4.35%
0.23%
Values in Rs Cr.
Direction Arrows
Net Sales

YoY Growth in nine months ended Dec 2025 is -0.08% vs 2.77% in Dec 2024

Direction Arrows
Standalone Net Profit

YoY Growth in nine months ended Dec 2025 is 40.65% vs 41.38% in Dec 2024

Annual Results Snapshot (Standalone) - Mar'26stock-summary

Mar'26
Mar'25
Change(%)
Net Sales
69.93
67.19
4.08%
Operating Profit (PBDIT) excl Other Income
3.00
2.76
8.70%
Interest
0.11
0.10
10.00%
Exceptional Items
0.00
0.00
Standalone Net Profit
1.77
1.55
14.19%
Operating Profit Margin (Excl OI)
4.29%
4.11%
0.18%
Values in Rs Cr.
Direction Arrows
Net Sales

YoY Growth in year ended Mar 2026 is 4.08% vs -0.13% in Mar 2025

Direction Arrows
Standalone Net Profit

YoY Growth in year ended Mar 2026 is 14.19% vs 6.16% in Mar 2025

stock-summaryCompany CV
About Sandu Pharmaceuticals Ltd stock-summary
stock-summary
Sandu Pharmaceuticals Ltd
Micro Cap
Pharmaceuticals & Biotechnology
Sandu Pharmaceuticals Ltd (SPL) was established in 1985. The Company is mainly engaged in the business of manufacturing and trading of Ayurvedic medicines under the brand name SANDU. SPL came out with a public issue of 17.70 lac equity shares at par, aggregating Rs 1.77 cr, in Sep.'94, to part-finance its new project in Goa costing Rs 7.28 cr to manufacture ayurvedic medicines and formulations.
Company Coordinates stock-summary
Company Details
Plot No 25/26/29 & 30, Pilerne Indl Estate Marra Bard Bardez Goa : 403511
Registrar Details
Sharex Dynamic (India) Pvt Ltd , Unit -1, Luthra Ind. Premises , Safed Pool, Andheri-Kurla Road, Andheri (E), Mumbai