
Compare Sangal Papers with Similar Stocks
Dashboard
Weak Long Term Fundamental Strength with an average Return on Capital Employed (ROCE) of 7.00%
- Poor long term growth as Net Sales has grown by an annual rate of 11.11% over the last 5 years
- Low ability to service debt as the company has a high Debt to EBITDA ratio of 4.71 times
Flat results in Mar 26
38.76% of Promoter Shares are Pledged
Below par performance in long term as well as near term
Stock DNA
Paper, Forest & Jute Products
INR 21 Cr (Micro Cap)
8.00
17
0.00%
0.63
5.07%
0.45
Total Returns (Price + Dividend) 
Sangal Papers for the last several years.
Risk Adjusted Returns v/s
Returns Beta

News
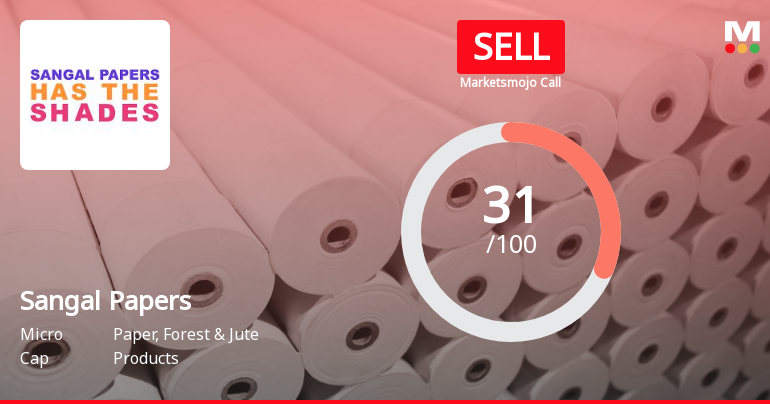
Sangal Papers Ltd Upgraded to Sell on Technical Improvements Despite Weak Fundamentals
Sangal Papers Ltd, a micro-cap player in the Paper, Forest & Jute Products sector, has seen its investment rating upgraded from Strong Sell to Sell as of 7 July 2026. This change reflects a nuanced shift in the company’s technical outlook despite persistent fundamental challenges, signalling cautious optimism among investors amid a volatile market backdrop.
Read full news article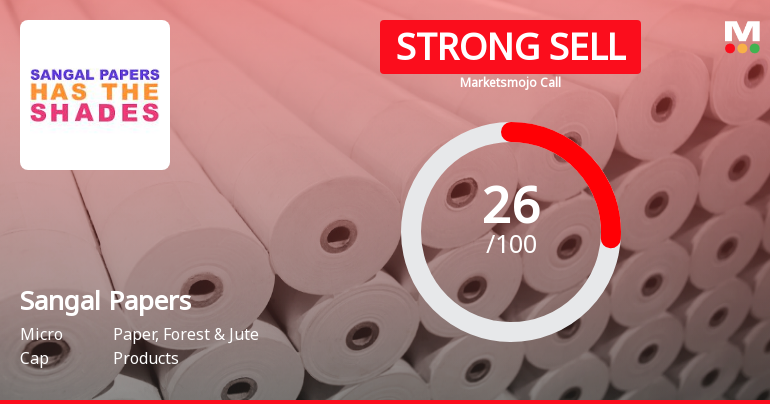
Sangal Papers Ltd Downgraded to Strong Sell Amid Weak Fundamentals and Bearish Technicals
Sangal Papers Ltd, a micro-cap player in the Paper, Forest & Jute Products sector, has been downgraded from a Sell to a Strong Sell rating as of 1 July 2026. This revision reflects deteriorating technical indicators, stagnant financial performance, and persistent fundamental weaknesses, signalling heightened risks for investors amid challenging market conditions.
Read full news article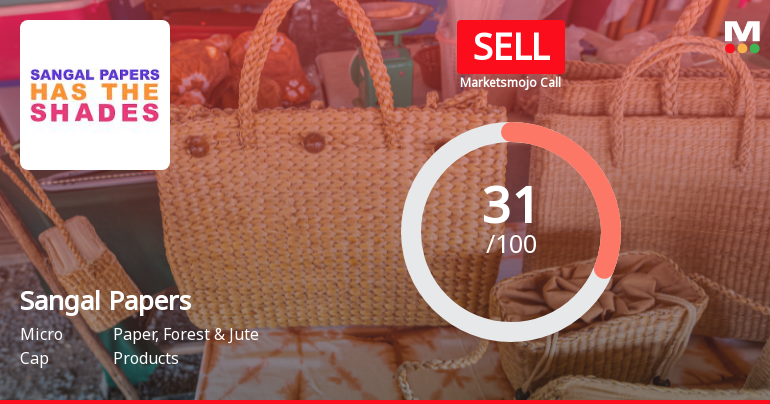
Sangal Papers Ltd Upgraded to Sell on Technical Improvements Despite Weak Fundamentals
Sangal Papers Ltd has seen its investment rating downgraded from Strong Sell to Sell as of 15 June 2026, reflecting a complex interplay of technical signals, valuation metrics, financial trends, and quality assessments. Despite some mild improvements in technical indicators, the company’s weak fundamentals and subdued financial performance continue to weigh heavily on investor sentiment.
Read full news article Announcements
Compliances-Certificate under Reg. 74 (5) of SEBI (DP) Regulations 2018
04-Jul-2026 | Source : BSECertificate under Reg 74(5) of SEBI (DP) REGULATIONS 2018
Compliances-Certificate under Reg. 74 (5) of SEBI (DP) Regulations 2018
04-Jul-2026 | Source : BSECertificate of RTA with Covering Letter under Reg 74(5) of SEBI ( DP) Regulations 2018
Closure of Trading Window
19-Jun-2026 | Source : BSEIntimation of Closure of Trading Window from 1st day of july till 48 hours from publication of quarterly results ending 30th day of June 2026.
Corporate Actions

No Upcoming Board Meetings

No Dividend history available

No Splits history available

No Bonus history available

No Rights history available
Quality key factors
Valuation key factors
Technicals key factors
 Technical Indicator Scale: Bearish, Mildly Bearish, Sideways, Mildly Bullish, Bullish Turned
 Shareholding Snapshot : Jun 2026
Shareholding Compare (%holding)
Non Institution
38.7565
Held by 0 Schemes
Held by 0 FIIs
Amit Sangal (9.26%)
Mahendra Girdharilal Wadhwani (2.72%)
58.54%
Quarterly Results Snapshot (Standalone) - Mar'26 - QoQ

QoQ Growth in quarter ended Mar 2026 is -21.37% vs -3.41% in Dec 2025

QoQ Growth in quarter ended Mar 2026 is 162.86% vs 16.67% in Dec 2025
Half Yearly Results Snapshot (Standalone) - Sep'25
Growth in half year ended Sep 2025 is 2.27% vs -2.40% in Sep 2024
Growth in half year ended Sep 2025 is -50.22% vs 384.78% in Sep 2024
Nine Monthly Results Snapshot (Standalone) - Dec'25
YoY Growth in nine months ended Dec 2025 is 6.87% vs -5.80% in Dec 2024
YoY Growth in nine months ended Dec 2025 is -39.17% vs 49.07% in Dec 2024
Annual Results Snapshot (Standalone) - Mar'26
YoY Growth in year ended Mar 2026 is -0.52% vs -5.29% in Mar 2025
YoY Growth in year ended Mar 2026 is -16.25% vs 14.57% in Mar 2025
About Sangal Papers Ltd

Company Coordinates


