
Compare Sanken Electric Co., Ltd. with Similar Stocks
Stock DNA
Other Electrical Equipment
JPY 138,589 Million (Small Cap)
NA (Loss Making)
NA
0.02%
0.28
-4.23%
1.12
Revenue and Profits:
Net Sales:
18,773 Million
(Quarterly Results - Sep 2025)
Net Profit:
-530 Million
Total Returns (Price + Dividend) 
TimePeriod
Price Return
Dividend Return
Total Return
3 Months
-1.84%
0%
-1.84%
6 Months
18.89%
0%
18.89%
1 Year
14.5%
0%
14.5%
2 Years
-37.8%
0%
-37.8%
3 Years
36.44%
0%
36.44%
4 Years
39.3%
0%
39.3%
5 Years
193.79%
0%
193.79%
Sanken Electric Co., Ltd. for the last several years.
Risk Adjusted Returns v/s
News
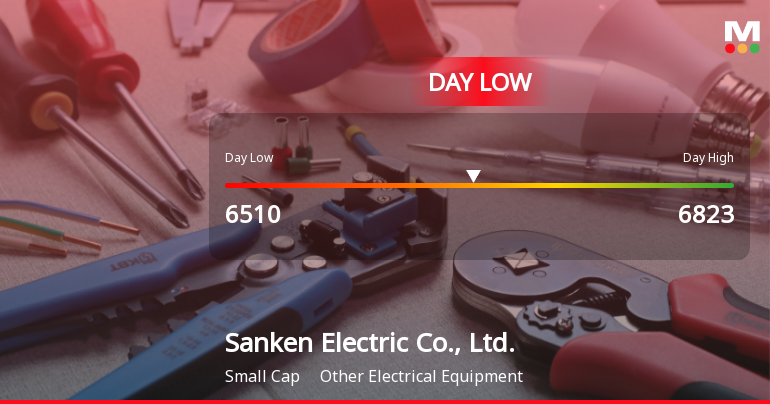
Sanken Electric Hits Day Low at JPY 6,510 Amid Price Pressure
Sanken Electric Co., Ltd. has faced notable volatility, with a significant stock decline today. The company has struggled over the past week and month, showing poor performance compared to the Japan Nikkei 225 index. High debt levels, low inventory turnover, and rising raw material costs further highlight its challenges.
Read full news article Announcements

No announcement available
Corporate Actions
No corporate action available
Quality key factors
Factor
Value
Sales Growth (5y)
-5.36%
EBIT Growth (5y)
-197.45%
EBIT to Interest (avg)
11.00
Debt to EBITDA (avg)
0.76
Net Debt to Equity (avg)
0.08
Sales to Capital Employed (avg)
0.81
Tax Ratio
2.58%
Dividend Payout Ratio
0
Pledged Shares
0
Institutional Holding
0
ROCE (avg)
8.76%
ROE (avg)
7.94%
Valuation key factors
Factor
Value
P/E Ratio
NA (Loss Making)
Industry P/E
Price to Book Value
1.36
EV to EBIT
-56.15
EV to EBITDA
30.37
EV to Capital Employed
1.34
EV to Sales
1.75
PEG Ratio
NA
Dividend Yield
0.01%
ROCE (Latest)
-2.38%
ROE (Latest)
-1.87%
Technicals key factors
Indicator
Weekly
Monthly
MACD
Mildly Bullish
Bearish
RSI
No Signal
No Signal
Bollinger Bands
Bullish
Bullish
Moving Averages
Mildly Bearish (Daily)
KST
Mildly Bullish
Bullish
Dow Theory
No Trend
No Trend
OBV
No Trend
No Trend
 Technical Indicator Scale: Bearish, Mildly Bearish, Sideways, Mildly Bullish, Bullish Turned
 Shareholding Snapshot
No data for shareholding present.
Shareholding Compare (%holding)
No data for shareholding present.
Quarterly Results Snapshot (Consolidated) - Sep'25 - YoY
Sep'25
Sep'24
Change(%)
Net Sales
18,773.00
22,964.00
-18.25%
Operating Profit (PBDIT) excl Other Income
830.00
1,144.00
-27.45%
Interest
193.00
287.00
-32.75%
Exceptional Items
-1,500.00
55,860.00
-102.69%
Consolidate Net Profit
-530.00
50,817.00
-101.04%
Operating Profit Margin (Excl OI)
-28.20%
-44.40%
1.62%
USD in Million.

Net Sales
YoY Growth in quarter ended Sep 2025 is -18.25% vs -62.75% in Sep 2024

Consolidated Net Profit
YoY Growth in quarter ended Sep 2025 is -101.04% vs 641.53% in Sep 2024
Annual Results Snapshot (Consolidated) - Mar'25
Mar'25
Mar'24
Change(%)
Net Sales
121,619.00
235,221.00
-48.30%
Operating Profit (PBDIT) excl Other Income
7,055.00
40,388.00
-82.53%
Interest
1,806.00
2,581.00
-30.03%
Exceptional Items
64,095.00
-7,302.00
977.77%
Consolidate Net Profit
49,198.00
2,394.00
1,955.05%
Operating Profit Margin (Excl OI)
-31.10%
83.10%
-11.42%
USD in Million.
Net Sales
YoY Growth in year ended Mar 2025 is -48.30% vs 4.36% in Mar 2024
Consolidated Net Profit
YoY Growth in year ended Mar 2025 is 1,955.05% vs -89.20% in Mar 2024
About Sanken Electric Co., Ltd.

Sanken Electric Co., Ltd.
Other Electrical Equipment
No Details Available.
Company Coordinates
No Company Details Available
InfinHub Market Technologies FZ-LLC, Building-2, Unit 112, Dubai Internet City, Dubai, United Arab Emirates
GET THE MARKETSMOJO APP


Company
Stocks
Portfolio


"Investment in securities markets are subject to market risk. Read all the related documents carefully before investing."