
Compare Sanstar with Similar Stocks
Dashboard
Weak Long Term Fundamental Strength with a -2.27% CAGR growth in Operating Profits over the last 5 years
- The company has been able to generate a Return on Equity (avg) of 5.80% signifying low profitability per unit of shareholders funds
Positive results in Mar 26
With ROE of 5, it has a Expensive valuation with a 3.1 Price to Book Value
Despite the size of the company, domestic mutual funds hold only 0.03% of the company
Market Beating Performance
Stock DNA
Other Agricultural Products
INR 2,188 Cr (Micro Cap)
62.00
42
0.00%
-0.20
4.96%
3.06
Total Returns (Price + Dividend) 
Sanstar for the last several years.
Risk Adjusted Returns v/s
Returns Beta

News

Sanstar Ltd is Rated Hold by MarketsMOJO
Sanstar Ltd is rated 'Hold' by MarketsMOJO, with this rating last updated on 01 June 2026. However, the analysis and financial metrics discussed here reflect the company’s current position as of 09 June 2026, providing investors with the most up-to-date view of the stock’s fundamentals, valuation, financial trends, and technical outlook.
Read full news article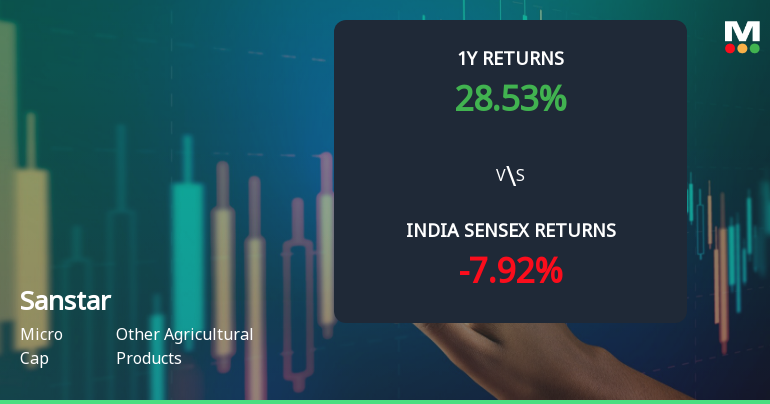
Sanstar Ltd Technical Momentum Shifts Signal Bullish Outlook Amid Market Volatility
Sanstar Ltd, a micro-cap player in the Other Agricultural Products sector, has witnessed a notable shift in its technical momentum, upgrading its outlook from mildly bullish to bullish. This transition is underscored by a confluence of positive signals across key technical indicators including MACD, RSI, moving averages, and Bollinger Bands, suggesting renewed investor confidence and potential for sustained price appreciation.
Read full news article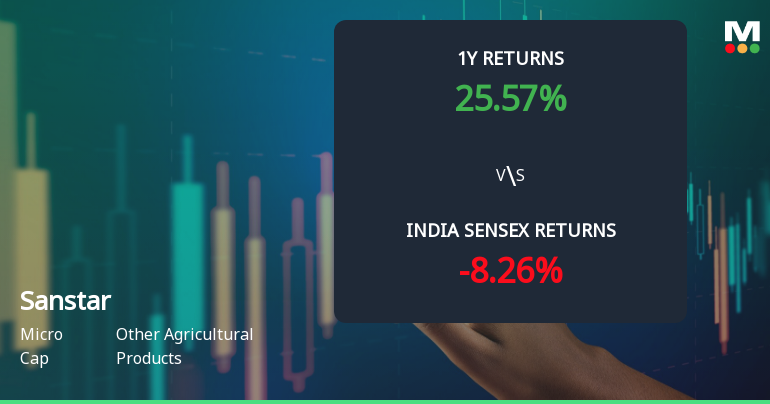
Sanstar Ltd Technical Momentum Shifts Amid Bullish Signals and Market Outperformance
Sanstar Ltd, a micro-cap player in the Other Agricultural Products sector, has exhibited a notable shift in price momentum and technical indicators, signalling a cautiously optimistic outlook. The stock’s recent performance, coupled with evolving technical signals such as MACD, RSI, and moving averages, suggests a transition from bearish tendencies to a more mildly bullish stance, warranting close attention from investors and market analysts alike.
Read full news article Announcements
Intimation Under Regulation 30 Of SEBI (Listing Obligations And Disclosure Requirements) Regulations 2015 For Clarification W.R.T. The Notice Of Extra-Ordinary General Meeting
12-Jun-2026 | Source : BSEPlease find enclosed herewith Clarification w.r.t the Notice of Extra Ordinary General Meeting scheduled to be held on 20th June 2026.
Corrigendum To The Notice Of The Extraordinary General Meeting
08-Jun-2026 | Source : BSECorrigendum to the Notice of Extraordinary General Meeting scheduled to be held on Saturday 20th June 2026
Announcement under Regulation 30 (LODR)-Newspaper Publication
01-Jun-2026 | Source : BSENewspaper Publication for Intimation of Extra Ordinary General Meeting scheduled to be held on Saturday June 20 2026 at 11:00 A.M.
Corporate Actions

No Upcoming Board Meetings

No Dividend history available

No Splits history available

No Bonus history available

No Rights history available
Quality key factors
Valuation key factors
Technicals key factors
 Technical Indicator Scale: Bearish, Mildly Bearish, Sideways, Mildly Bullish, Bullish Turned
 Shareholding Snapshot : Mar 2026
Shareholding Compare (%holding)
Promoters
0.0103
Held by 1 Schemes (0.01%)
Held by 5 FIIs (0.02%)
Sambhav Gautamchand Chowdhary (17.61%)
Gagandeep Credit Capital Pvt Ltd (1.73%)
21.53%
Quarterly Results Snapshot (Standalone) - Mar'26 - QoQ

QoQ Growth in quarter ended Mar 2026 is 7.44% vs 2.71% in Dec 2025

QoQ Growth in quarter ended Mar 2026 is 49.89% vs 2,069.84% in Dec 2025
Half Yearly Results Snapshot (Standalone) - Sep'25
Growth in half year ended Sep 2025 is -28.09% vs -8.04% in Sep 2024
Growth in half year ended Sep 2025 is -98.79% vs -16.42% in Sep 2024
Nine Monthly Results Snapshot (Standalone) - Dec'25
YoY Growth in nine months ended Dec 2025 is -22.12% vs -11.39% in Dec 2024
YoY Growth in nine months ended Dec 2025 is -63.53% vs -24.36% in Dec 2024
Annual Results Snapshot (Standalone) - Mar'26
YoY Growth in year ended Mar 2026 is -18.05% vs -13.75% in Mar 2025
YoY Growth in year ended Mar 2026 is -21.33% vs -34.42% in Mar 2025
About Sanstar Ltd

Company Coordinates


