
Compare Sanwaria Consum. with Similar Stocks
Dashboard
With a Negative Book Value, the company has a Weak Long Term Fundamental Strength
- Low ability to service debt as the company has a high Debt to EBITDA ratio of -913.55 times
- The company has been able to generate a Return on Capital Employed (avg) of 8.90% signifying low profitability per unit of total capital (equity and debt)
Flat results in Mar 26
Risky - Negative EBITDA
Total Returns (Price + Dividend) 
Latest dividend: 0.05 per share ex-dividend date: Sep-25-2017
Risk Adjusted Returns v/s
Returns Beta

News

Sanwaria Consumer Ltd Locks at Upper Circuit With 2% Gain — Buyers Queue, Sellers Absent
At Rs 0.23, the buying was done — not because demand dried up, but because the exchange wouldn't let the stock go any higher. Sanwaria Consumer Ltd locked at its upper circuit of 2% on 23 Jun 2026, with buyers queuing and no sellers willing to part with shares.
Read full news article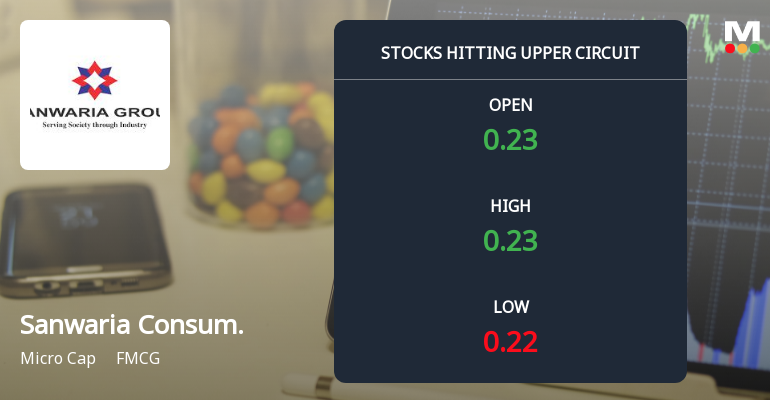
Sanwaria Consumer Ltd Locks at Upper Circuit With 2% Gain — Buyers Queue, Sellers Absent
At Rs 0.23, the buying was done — not because demand dried up, but because the exchange wouldn't let the stock go any higher. Sanwaria Consumer Ltd locked at its upper circuit of 2% on 22 Jun 2026, with buyers queuing and no sellers willing to part with shares.
Read full news article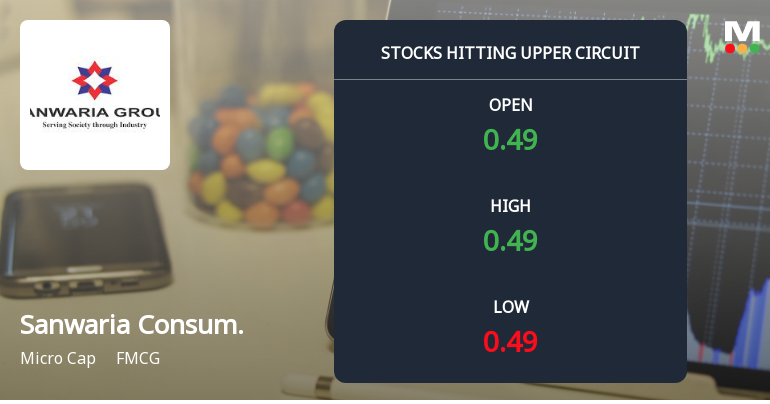
Sanwaria Consumer Ltd Locks at Upper Circuit With 4.55% Gain — Buyers Queue, Sellers Absent
At Rs 0.23, the buying was done — not because demand dried up, but because the exchange wouldn't let the stock go any higher. Sanwaria Consumer Ltd locked at its upper circuit of 4.55% on 19 Jun 2026, with buyers queuing and no sellers willing to part with shares.
Read full news article Announcements
Board Meeting Outcome for Outcome Of The Boardmeeting Held On 25.05.2026
25-May-2026 | Source : BSEOutcome of the Board meeting held on 25.05.2026 and considered Standalone and Consolidated Audited Financial Results of the Comany for the Quater and year ended on 31.03.2026
Audited Financial Results For The Year And Quarter Ended On March 2026
25-May-2026 | Source : BSEStandalone and Consolidated Audited Financial Results of the Company
Board Meeting Intimation for Intimation For Board Meeting
18-May-2026 | Source : BSESanwaria Consumer Ltd-has informed BSE that the meeting of the Board of Directors of the Company is scheduled on 25/05/2026 inter alia to consider and approve Intimaiton for Board metting held on 25.05.2026 to consider audited standalone and consolidated financila statement
Corporate Actions

No Upcoming Board Meetings

Sanwaria Consumer Ltd has declared 5% dividend, ex-date: 25 Sep 17

Sanwaria Consumer Ltd has announced 1:2 stock split, ex-date: 04 Feb 08

Sanwaria Consumer Ltd has announced 1:1 bonus issue, ex-date: 03 Jul 17

No Rights history available
Quality key factors
Valuation key factors
Technicals key factors
 Technical Indicator Scale: Bearish, Mildly Bearish, Sideways, Mildly Bullish, Bullish Turned
 Shareholding Snapshot : Mar 2026
Shareholding Compare (%holding)
Non Institution
None
Held by 0 Schemes
Held by 0 FIIs
Anil Kumar Agrawal (7.88%)
None
78.97%
Quarterly Results Snapshot (Consolidated) - Mar'26 - QoQ
QoQ Growth in quarter ended Mar 2026 is 0.00% vs 0.00% in Dec 2025

QoQ Growth in quarter ended Mar 2026 is -28.72% vs 15.32% in Dec 2025
Half Yearly Results Snapshot (Consolidated) - Sep'25
Growth in half year ended Sep 2025 is -50.00% vs 0.00% in Sep 2024

Growth in half year ended Sep 2025 is 53.66% vs 43.21% in Sep 2024
Nine Monthly Results Snapshot (Consolidated) - Mar'26
YoY Growth in nine months ended Mar 2026 is -33.33% vs 200.00% in Mar 2026
YoY Growth in nine months ended Mar 2026 is 33.74% vs 32.37% in Mar 2026
Annual Results Snapshot (Consolidated) - Mar'26
YoY Growth in year ended Mar 2026 is 1.89% vs -0.93% in Mar 2025
YoY Growth in year ended Mar 2026 is 2.55% vs 25.69% in Mar 2025
About Sanwaria Consumer Ltd

Company Coordinates


