
Compare Sapphire Foods with Similar Stocks
Dashboard
Company's ability to service its debt is weak with a poor EBIT to Interest (avg) ratio of 1.33
- Company's ability to service its debt is weak with a poor EBIT to Interest (avg) ratio of 1.33
- The company has been able to generate a Return on Equity (avg) of 5.92% signifying low profitability per unit of shareholders funds
Consistent Underperformance against the benchmark over the last 3 years
Stock DNA
Leisure Services
INR 5,990 Cr (Small Cap)
800.00
46
0.00%
0.97
-0.58%
4.50
Total Returns (Price + Dividend) 
Sapphire Foods for the last several years.
Risk Adjusted Returns v/s
Returns Beta

News
Sapphire Foods India Ltd Reports Strong Quarterly Gains Amid Lingering Operational Challenges
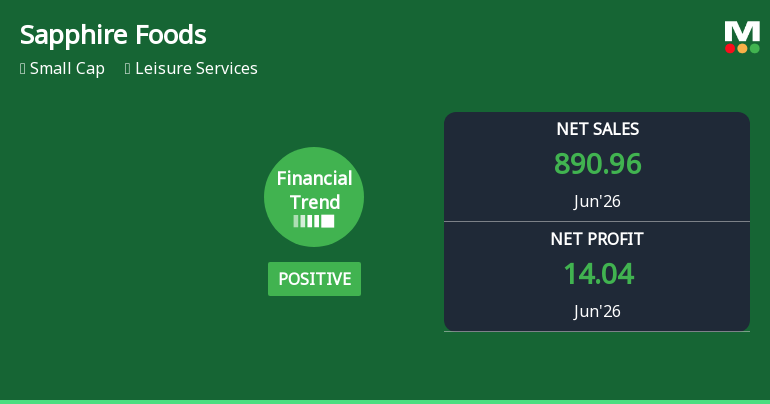
Sapphire Foods India Ltd has demonstrated a marked improvement in its financial performance for the quarter ended June 2026, reversing a previously flat trend to a positive trajectory. Despite ongoing concerns around capital efficiency and leverage, the company posted record quarterly revenues and profits, signalling a potential turnaround in its operational momentum within the Leisure Services sector.
Read full news article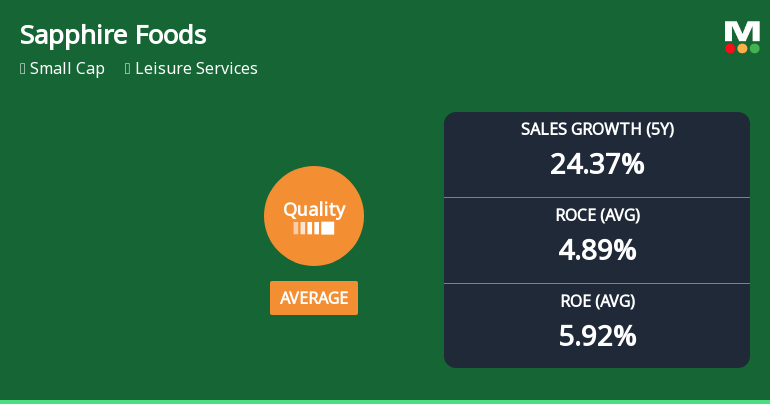
Sapphire Foods India Ltd Quality Parameters Show Mixed Signals Amidst Market Challenges
Sapphire Foods India Ltd has seen its quality grade improve from below average to average, signalling a notable shift in its business fundamentals. This upgrade reflects changes in key financial metrics such as return on equity (ROE), return on capital employed (ROCE), debt levels, and growth consistency. Despite the positive revision, the company’s overall Mojo Score remains at 45.0 with a Sell rating, indicating that challenges persist amid improving fundamentals.
Read full news articleAre Sapphire Foods India Ltd latest results good or bad?
Sapphire Foods India Ltd has reported its financial results for the quarter ending June 2026, showcasing a significant milestone with net sales reaching ₹890.96 crores, representing a year-on-year growth of 14.69% and a sequential increase of 12.46% from the previous quarter. This performance is attributed to the company's aggressive expansion strategy and improving same-store sales across its KFC and Pizza Hut outlets. Despite the robust revenue growth, the company's profitability metrics present a more complex picture. The net profit for the quarter stood at ₹14.04 crores, marking a substantial year-on-year improvement of 880.00% from a loss in the same quarter last year. However, the operating margin, which is reported at 15.69%, remains compressed compared to historical highs, indicating ongoing challenges with input cost inflation and competitive pricing pressures within the quick-service restaurant s...
Read full news article Announcements
Corporate Actions

No Upcoming Board Meetings

No Dividend history available

Sapphire Foods India Ltd has announced 2:10 stock split, ex-date: 05 Sep 24

No Bonus history available

No Rights history available
Quality key factors
Valuation key factors
Technicals key factors
 Technical Indicator Scale: Bearish, Mildly Bearish, Sideways, Mildly Bullish, Bullish Turned
 Shareholding Snapshot : Jun 2026
Shareholding Compare (%holding)
Mutual Funds
None
Held by 23 Schemes (35.87%)
Held by 117 FIIs (25.25%)
Sapphire Foods Mauritius Limited (23.81%)
Nippon Life India Trustee Ltd-a/c Nippon India Small Cap Fund (8.56%)
3.88%
Quarterly Results Snapshot (Consolidated) - Jun'26 - QoQ

QoQ Growth in quarter ended Jun 2026 is 12.46% vs -2.66% in Mar 2026
QoQ Growth in quarter ended Jun 2026 is 211.34% vs -163.26% in Mar 2026
Half Yearly Results Snapshot (Consolidated) - Sep'25

Growth in half year ended Sep 2025 is 7.45% vs 9.02% in Sep 2024
Growth in half year ended Sep 2025 is -365.88% vs -86.40% in Sep 2024
Nine Monthly Results Snapshot (Consolidated) - Dec'25
YoY Growth in nine months ended Dec 2025 is 7.49% vs 10.60% in Dec 2024
YoY Growth in nine months ended Dec 2025 is -210.88% vs -65.37% in Dec 2024
Annual Results Snapshot (Consolidated) - Mar'26
YoY Growth in year ended Mar 2026 is 8.45% vs 11.09% in Mar 2025
YoY Growth in year ended Mar 2026 is -266.03% vs -63.55% in Mar 2025
About Sapphire Foods India Ltd

Company Coordinates


