
Compare Saraswati Saree with Similar Stocks
Stock DNA
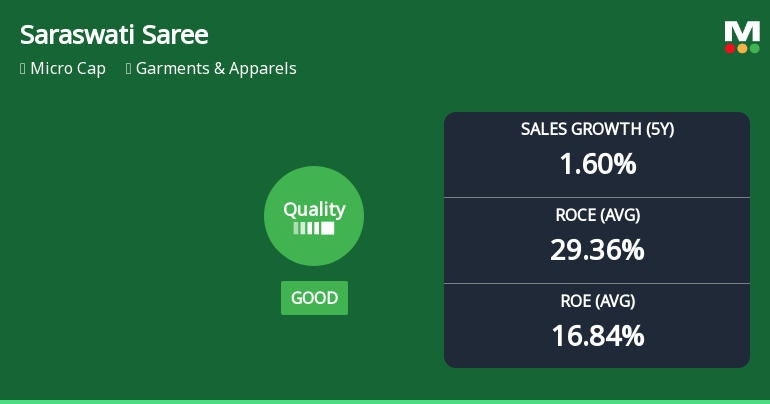
Garments & Apparels
INR 225 Cr (Micro Cap)
10.00
77
0.00%
-0.12
12.41%
1.18
Total Returns (Price + Dividend) 
Latest dividend: 1.5 per share ex-dividend date: Apr-09-2025
Risk Adjusted Returns v/s
Returns Beta

News
Saraswati Saree Depot Ltd Quality Grade Upgrade Signals Fundamental Strengthening
Saraswati Saree Depot Ltd has recently seen its quality grading improve from average to good, reflecting notable shifts in its business fundamentals. This upgrade comes amid a challenging market backdrop and a significant decline in stock price over the past year. We analyse the key financial metrics, including return on equity (ROE), return on capital employed (ROCE), debt levels, and growth consistency to understand what has improved and where concerns remain for investors.
Read full news article
Saraswati Saree Depot Ltd is Rated Sell
Saraswati Saree Depot Ltd is rated 'Sell' by MarketsMOJO, with this rating last updated on 14 February 2026. However, the analysis and financial metrics discussed here reflect the stock's current position as of 11 June 2026, providing investors with an up-to-date view of the company’s performance and outlook.
Read full news article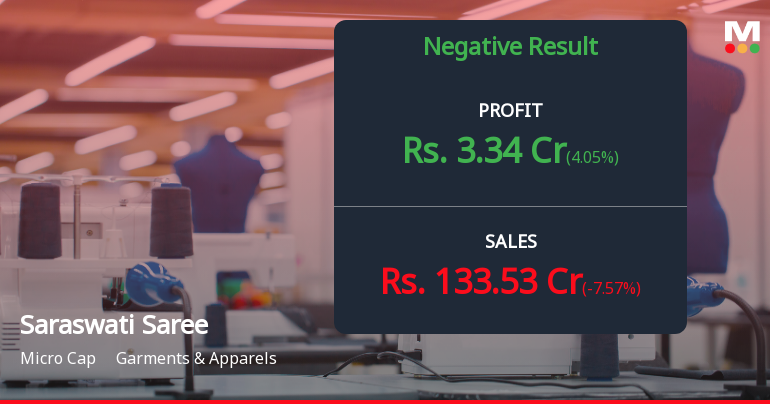
Saraswati Saree Depot Q4 FY26: Profitability Under Pressure as Margins Compress Sharply
Saraswati Saree Depot Ltd., a micro-cap player in the garments and apparels sector with a market capitalisation of ₹242.00 crores, reported a challenging fourth quarter for FY26, with net profit declining to ₹3.34 crores in Q4 FY26 from ₹3.21 crores in Q3 FY26, marking a modest sequential growth of 4.05%. However, on a year-on-year basis, the company witnessed a sharp decline of 52.49% from ₹7.03 crores in Q4 FY25, reflecting significant profitability pressures despite operating in a traditionally stable sector.
Read full news article Announcements
Board Meeting Outcome for Outcome Of Board Meeting Held Today I.E June 8 2026.
08-Jun-2026 | Source : BSEThe Board at its meeting held today considered the following matters: 1. Noting of cessation of Mr. Maniklal Karmakar (DIN: 10131711) as an Independent Director of the Company w.e.f June 19 2026. 2. Approval of re-appointment of Mr. Yatiraj Marda (DIN: 10174363) as an Independent Additional Director of the Company for 5 years subject to shareholders approval at the ensuing AGM by way of Special Resolution. 3. Approval of re- appointment of Mr. Amar Thorat (DIN: 02223782) as an Independent Additional Director of the Company for 5 years subject to shareholders approval at the ensuing AGM by way of Special Resolution. 4. Appointment of Mr. Rajesh Dulhani (DIN: 09104989) Executive Director as Chairman of the Company
Announcement under Regulation 30 (LODR)-Change in Management
08-Jun-2026 | Source : BSEThe Board at its meeting held today considered the following: 1. Noting of cessation of Mr. Maniklal Karmakar (DIN: 10131711) as an Independent Director of the Company. 2. Approval of re-appointment of Mr. Yatiraj Marda (DIN: 10174363) as an Independent Additional Director of the Company for 5 years subject to shareholders approval at the ensuing AGM by way of special resolution. 3. Approval of re-appointment of Mr. Amar Thorat (DIN: 02223782) as an Independent Additional Director of the Company for 5 years subject to shareholders approval at the ensuing AGM by way of special resolution. 4. Appointment of Mr. Rajesh Dulhani ( DIN: 09104989) Executive Director as Chairman of the Company.
Announcement under Regulation 30 (LODR)-Change in Management
05-Jun-2026 | Source : BSEThis is to inform that Mr. Shankar Laxmandas Dulhani Chairman and Executive Director of the Company has resigned with immediate effect.
Corporate Actions

No Upcoming Board Meetings

Saraswati Saree Depot Ltd has declared 15% dividend, ex-date: 09 Apr 25

No Splits history available

No Bonus history available

No Rights history available
Quality key factors
Valuation key factors
Technicals key factors
 Technical Indicator Scale: Bearish, Mildly Bearish, Sideways, Mildly Bullish, Bullish Turned
 Shareholding Snapshot : Mar 2026
Shareholding Compare (%holding)
Promoters
None
Held by 0 Schemes
Held by 3 FIIs (0.02%)
Rajesh Sujandas Dulhani (10.45%)
None
23.4%
Quarterly Results Snapshot (Standalone) - Mar'26 - QoQ

QoQ Growth in quarter ended Mar 2026 is -7.57% vs -30.67% in Dec 2025
QoQ Growth in quarter ended Mar 2026 is 4.05% vs -69.46% in Dec 2025
Half Yearly Results Snapshot (Standalone) - Sep'25
Growth in half year ended Sep 2025 is 19.67% vs 13.63% in Sep 2024

Growth in half year ended Sep 2025 is 7.59% vs 29.93% in Sep 2024
Nine Monthly Results Snapshot (Standalone) - Dec'25
YoY Growth in nine months ended Dec 2025 is 4.27% vs 24.77% in Dec 2024
YoY Growth in nine months ended Dec 2025 is -14.78% vs 44.30% in Dec 2024
Annual Results Snapshot (Standalone) - Mar'26
YoY Growth in year ended Mar 2026 is 4.57% vs -1.20% in Mar 2025
YoY Growth in year ended Mar 2026 is -23.45% vs 3.56% in Mar 2025
About Saraswati Saree Depot Ltd

Company Coordinates


