
Compare Sarda Energy with Similar Stocks
Dashboard
Strong ability to service debt as the company has a low Debt to EBITDA ratio of 1.52 times
Healthy long term growth as Net Sales has grown by an annual rate of 23.98% and Operating profit at 32.45%
Flat results in Dec 25
With ROE of 15.2, it has a Expensive valuation with a 2.7 Price to Book Value
Despite the size of the company, domestic mutual funds hold only 1.73% of the company
Consistent Returns over the last 3 years
Stock DNA
Ferrous Metals
INR 18,512 Cr (Small Cap)
18.00
14
0.28%
0.06
15.19%
2.74
Total Returns (Price + Dividend) 
Latest dividend: 1.5 per share ex-dividend date: Aug-22-2025
Risk Adjusted Returns v/s
Returns Beta

News
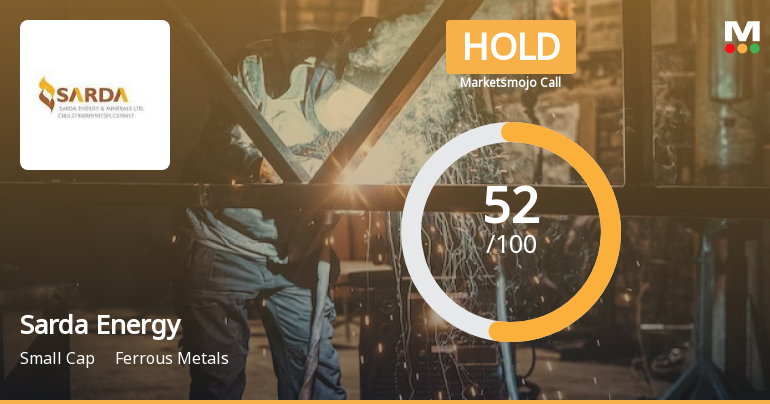
Sarda Energy & Minerals Ltd is Rated Hold
Sarda Energy & Minerals Ltd is rated 'Hold' by MarketsMOJO, with this rating last updated on 09 Apr 2026. However, the analysis and financial metrics discussed here reflect the company’s current position as of 13 May 2026, providing investors with an up-to-date view of its fundamentals, returns, and market standing.
Read full news articleWhen is the next results date for Sarda Energy & Minerals Ltd?
The next results date for Sarda Energy & Minerals Ltd is scheduled for 23 May 2026....
Read full news article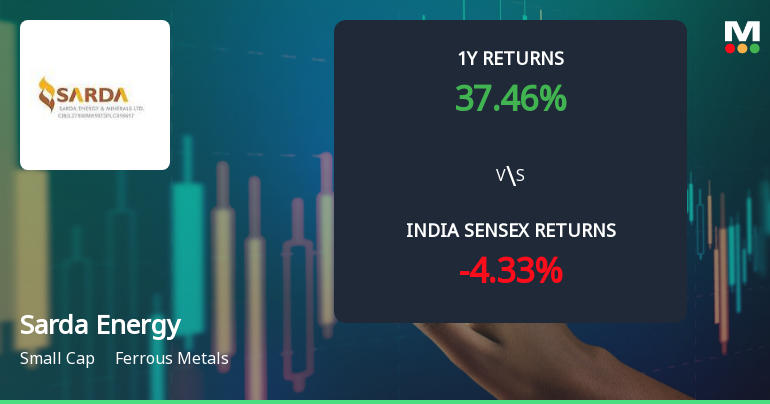
Sarda Energy & Minerals Ltd: Technical Momentum Shifts Amid Mixed Market Signals
Sarda Energy & Minerals Ltd, a small-cap player in the ferrous metals sector, has experienced a nuanced shift in its technical momentum, moving from a bullish to a mildly bullish stance. Despite a day’s decline of 1.90%, the stock’s broader technical indicators reveal a complex interplay of bullish and bearish signals, reflecting both resilience and caution among investors.
Read full news article Announcements
Closure of Trading Window
11-May-2026 | Source : BSEClosure of Trading Window
Board Meeting Intimation for Considering And Approving Audited Results And Audited Financial Statements For F.Y. 2025-26 And Dividend For F.Y. 2025-26 If Any.
11-May-2026 | Source : BSESarda Energy & Minerals Ltd-has informed BSE that the meeting of the Board of Directors of the Company is scheduled on 23/05/2026 inter alia to consider and approve Audited results and audited financial statements for F.Y. 2025-26 and dividend for F.Y. 2025-26 if any.
Announcement under Regulation 30 (LODR)-Newspaper Publication
29-Apr-2026 | Source : BSENewspaper Publication
Corporate Actions

23 May 2026

Sarda Energy & Minerals Ltd has declared 150% dividend, ex-date: 22 Aug 25

Sarda Energy & Minerals Ltd has announced 1:10 stock split, ex-date: 04 Aug 23

No Bonus history available

No Rights history available
Quality key factors
Valuation key factors
Technicals key factors
 Technical Indicator Scale: Bearish, Mildly Bearish, Sideways, Mildly Bullish, Bullish Turned
 Shareholding Snapshot : Mar 2026
Shareholding Compare (%holding)
Promoters
None
Held by 17 Schemes (0.46%)
Held by 101 FIIs (3.51%)
Chhattisgarh Investments Ltd. (39.04%)
Abakkus Emerging Opportunities Fund -1 (1.45%)
15.65%
Quarterly Results Snapshot (Consolidated) - Dec'25 - YoY

YoY Growth in quarter ended Dec 2025 is -3.27% vs 42.55% in Dec 2024
YoY Growth in quarter ended Dec 2025 is -3.54% vs 68.45% in Dec 2024
Half Yearly Results Snapshot (Consolidated) - Sep'25

Growth in half year ended Sep 2025 is 51.61% vs 1.53% in Sep 2024
Growth in half year ended Sep 2025 is 92.19% vs 26.55% in Sep 2024
Nine Monthly Results Snapshot (Consolidated) - Dec'25
YoY Growth in nine months ended Dec 2025 is 30.34% vs 14.27% in Dec 2024
YoY Growth in nine months ended Dec 2025 is 60.25% vs 38.00% in Dec 2024
Annual Results Snapshot (Consolidated) - Mar'25
YoY Growth in year ended Mar 2025 is 20.03% vs -8.16% in Mar 2024
YoY Growth in year ended Mar 2025 is 33.81% vs -13.14% in Mar 2024
About Sarda Energy & Minerals Ltd

Company Coordinates


