
Compare Sarla Performanc with Similar Stocks
Dashboard
Company has a Debt to Equity ratio (avg) of 0.19 times
Poor long term growth as Operating profit has grown by an annual rate -15.30% of over the last 5 years
Negative results in Mar 26
With ROCE of 2.1, it has a Expensive valuation with a 1.6 Enterprise value to Capital Employed
Despite the size of the company, domestic mutual funds hold only 0% of the company
Underperformed the market in the last 1 year
Stock DNA
Garments & Apparels
INR 840 Cr (Micro Cap)
14.00
26
0.00%
0.22
12.43%
1.62
Total Returns (Price + Dividend) 
Latest dividend: 3.0000000000000004 per share ex-dividend date: Jun-18-2025
Risk Adjusted Returns v/s
Returns Beta

News
Sarla Performance Fibers Ltd is Rated Hold
Sarla Performance Fibers Ltd is rated Hold by MarketsMOJO, with this rating last updated on 06 July 2026. However, the analysis and financial metrics discussed here reflect the company’s current position as of 18 July 2026, providing investors with an up-to-date view of its fundamentals, returns, and market standing.
Read full news article
Sarla Performance Fibers Ltd Valuation Shifts Signal Renewed Price Attractiveness
Sarla Performance Fibers Ltd has witnessed a notable shift in its valuation parameters, moving from an expensive to a fair valuation grade. This change, coupled with its current price-to-earnings (P/E) ratio of 12.92 and price-to-book value (P/BV) of 1.61, marks a significant improvement in price attractiveness relative to its historical averages and peer group within the Garments & Apparels sector.
Read full news article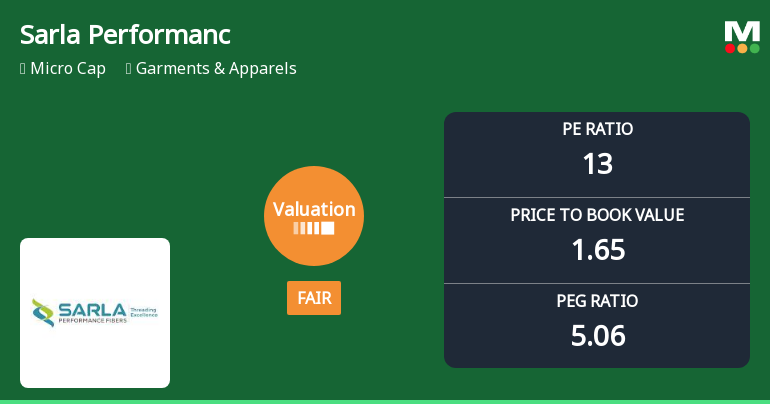
Sarla Performance Fibers Ltd: Valuation Shifts Signal Renewed Price Attractiveness
Sarla Performance Fibers Ltd has witnessed a notable shift in its valuation parameters, moving from an expensive to a fair valuation grade. This change, coupled with its recent upgrade from a Sell to a Hold rating, highlights a renewed price attractiveness for investors amid a challenging market backdrop for the Garments & Apparels sector.
Read full news article Announcements
AGM\/Book Closure
05-Sep-2019 | Source : NSE
| Sarla Performance Fibers Limited has informed the Exchange that the Register of Members & Share Transfer Books of the Company will remain closed from September 20, 2019 to September 27, 2019 (both days inclusive) for the purpose of Annual General Meeting and Payment of Dividend. |
AGM\/Book Closure
04-Sep-2019 | Source : NSE
| Sarla Performance Fibers Limited has informed the Exchange that the Register of Members & Share Transfer Books of the Company will remain closed from September 20, 2019 to September 27, 2019 (both days inclusive) for the purpose of Annual General Meeting and payment of dividend. |
Shareholders meeting
30-Aug-2019 | Source : NSE
| Sarla Performance Fibers Limited has informed the Exchange regarding Notice of Annual General Meeting to be held on September 27, 2019 |
Corporate Actions

No Upcoming Board Meetings

Sarla Performance Fibers Ltd has declared 200% dividend, ex-date: 22 Jul 26

Sarla Performance Fibers Ltd has announced 1:10 stock split, ex-date: 29 Oct 15

No Bonus history available

No Rights history available
Quality key factors
Valuation key factors
Technicals key factors
 Technical Indicator Scale: Bearish, Mildly Bearish, Sideways, Mildly Bullish, Bullish Turned
 Shareholding Snapshot : Jun 2026
Shareholding Compare (%holding)
Promoters
None
Held by 0 Schemes
Held by 3 FIIs (0.64%)
Satidham Industries Private Limited (30.36%)
Anil Kumar Goel (2.73%)
29.66%
Quarterly Results Snapshot (Consolidated) - Mar'26 - QoQ

QoQ Growth in quarter ended Mar 2026 is 14.94% vs -16.72% in Dec 2025

QoQ Growth in quarter ended Mar 2026 is -1,262.57% vs -72.94% in Dec 2025
Half Yearly Results Snapshot (Consolidated) - Sep'25
Growth in half year ended Sep 2025 is -6.76% vs 24.03% in Sep 2024
Growth in half year ended Sep 2025 is 15.33% vs 178.36% in Sep 2024
Nine Monthly Results Snapshot (Consolidated) - Dec'25
YoY Growth in nine months ended Dec 2025 is -8.59% vs 17.79% in Dec 2024
YoY Growth in nine months ended Dec 2025 is -6.36% vs 131.78% in Dec 2024
Annual Results Snapshot (Consolidated) - Mar'26
YoY Growth in year ended Mar 2026 is -6.06% vs 11.44% in Mar 2025
YoY Growth in year ended Mar 2026 is -121.06% vs 89.49% in Mar 2025
About Sarla Performance Fibers Ltd

Company Coordinates


