
Compare Sattva Sukun with Similar Stocks
Dashboard
With a Operating Losses, the company has a Weak Long Term Fundamental Strength
- Company's ability to service its debt is weak with a poor EBIT to Interest (avg) ratio of -0.11
- The company has been able to generate a Return on Equity (avg) of 5.09% signifying low profitability per unit of shareholders funds
Risky - Negative EBITDA
Total Returns (Price + Dividend) 
Sattva Sukun for the last several years.
Risk Adjusted Returns v/s
Returns Beta

News
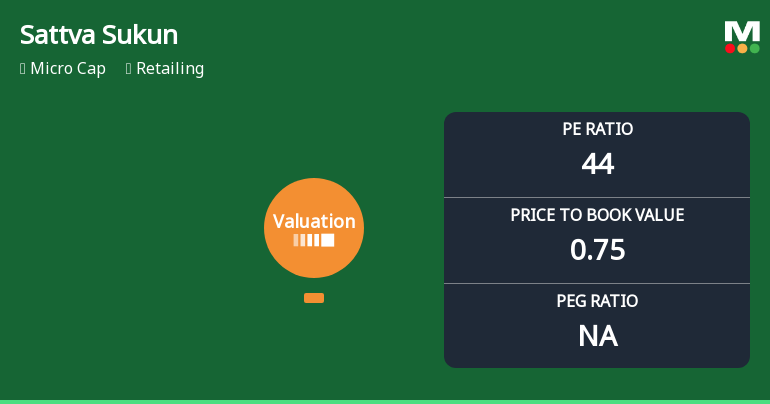
Sattva Sukun Lifecare Ltd Valuation Shifts Signal Elevated Risk Amid Retail Sector Challenges
Sattva Sukun Lifecare Ltd, a micro-cap player in the retailing sector, has seen its valuation parameters deteriorate sharply, prompting a downgrade in its Mojo Grade to Strong Sell. With a price-to-earnings (P/E) ratio soaring to 44.09 and a price-to-book value (P/BV) of 0.75, the stock now appears riskier compared to its historical averages and peer group, raising concerns about its price attractiveness for investors.
Read full news article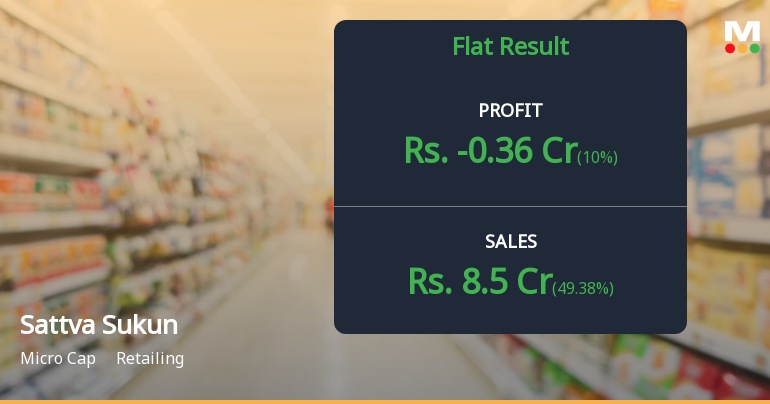
Sattva Sukun Lifecare Q4 FY26: Losses Deepen Despite Revenue Surge
Sattva Sukun Lifecare Ltd., a micro-cap retailing company with a market capitalisation of ₹28.00 crores, reported a consolidated net loss of ₹0.36 crores for Q4 FY26 (Mar'26), marking a deterioration from the ₹0.40 crores loss in Q3 FY26 and a sharp reversal from the ₹0.84 crores profit posted in the year-ago quarter. The loss represents a year-on-year decline of 142.86%, raising serious concerns about the company's operational sustainability despite robust top-line growth.
Read full news article Announcements
Announcement under Regulation 30 (LODR)-Newspaper Publication
08-Jun-2026 | Source : BSENews paper Publication
Statement Of Deviation
04-Jun-2026 | Source : BSEstatement
Audited Financial Results (Standalone And Consolidated) For The Quarter And Year Ended March 31 2026
04-Jun-2026 | Source : BSEAudited Result
Corporate Actions

No Upcoming Board Meetings

No Dividend history available

Sattva Sukun Lifecare Ltd has announced 1:5 stock split, ex-date: 25 Oct 24

Sattva Sukun Lifecare Ltd has announced 3:5 bonus issue, ex-date: 17 Jan 25

Sattva Sukun Lifecare Ltd has announced 5:2 rights issue, ex-date: 09 May 25
Quality key factors
Valuation key factors
Technicals key factors
 Technical Indicator Scale: Bearish, Mildly Bearish, Sideways, Mildly Bullish, Bullish Turned
 Shareholding Snapshot : Mar 2026
Shareholding Compare (%holding)
Non Institution
None
Held by 0 Schemes
Held by 0 FIIs
Roshan Dealmark Private Limited (6.37%)
L7 Hitech Private Limited (6.68%)
73.53%
Quarterly Results Snapshot (Consolidated) - Mar'26 - QoQ

QoQ Growth in quarter ended Mar 2026 is 49.38% vs -66.21% in Dec 2025
QoQ Growth in quarter ended Mar 2026 is 10.00% vs -151.28% in Dec 2025
Half Yearly Results Snapshot (Consolidated) - Sep'25
Growth in half year ended Sep 2025 is 699.12% vs 115.24% in Sep 2024

Growth in half year ended Sep 2025 is 37.50% vs 174.29% in Sep 2024
Nine Monthly Results Snapshot (Consolidated) - Dec'25
YoY Growth in nine months ended Dec 2025 is 462.80% vs 64.20% in Dec 2024
YoY Growth in nine months ended Dec 2025 is -44.24% vs 126.03% in Dec 2024
Annual Results Snapshot (Consolidated) - Mar'26
YoY Growth in year ended Mar 2026 is 513.12% vs 48.17% in Mar 2025
YoY Growth in year ended Mar 2026 is -95.58% vs 109.24% in Mar 2025
About Sattva Sukun Lifecare Ltd

Company Coordinates


