
 Price Point
Compare Sattva Sukun with Similar Stocks
ScoreDashboard
With a Operating Losses, the company has a Weak Long Term Fundamental Strength
- Company's ability to service its debt is weak with a poor EBIT to Interest (avg) ratio of -0.24
- The company has been able to generate a Return on Equity (avg) of 5.09% signifying low profitability per unit of shareholders funds
Risky - Negative EBITDA
Mojo ParametersStock DNA

Retailing

INR 29 Cr (Micro Cap)

NA (Loss Making)
22

0.00%

0.05

1.55%

0.66
Total ReturnsTotal Returns (Price + Dividend) 
Sattva Sukun for the last several years.
Risk Adjusted Returns v/s
Returns Beta
 News & Corporate Actions
News
Are Sattva Sukun Lifecare Ltd latest results good or bad?
Sattva Sukun Lifecare Ltd's latest financial results for Q1 FY27 reveal significant operational challenges. The company reported consolidated net sales of ₹0.64 crores, which represents a substantial decline of 92.47% from the previous quarter's ₹8.50 crores and a decrease of 47.54% year-on-year from ₹1.22 crores in Q1 FY26. This sharp revenue contraction raises concerns about the sustainability of its business model in the competitive retail sector. The company's consolidated net profit for the quarter was a loss of ₹0.09 crores, indicating a reversal from profitability and reflecting a considerable setback compared to previous periods. The operating margin, excluding other income, fell to -37.5%, down from 64.75% in the same quarter last year, highlighting severe cost control issues and operational distress. Additionally, the return on equity (ROE) stands at a low 1.55%, suggesting weak capital efficien...
Read full news article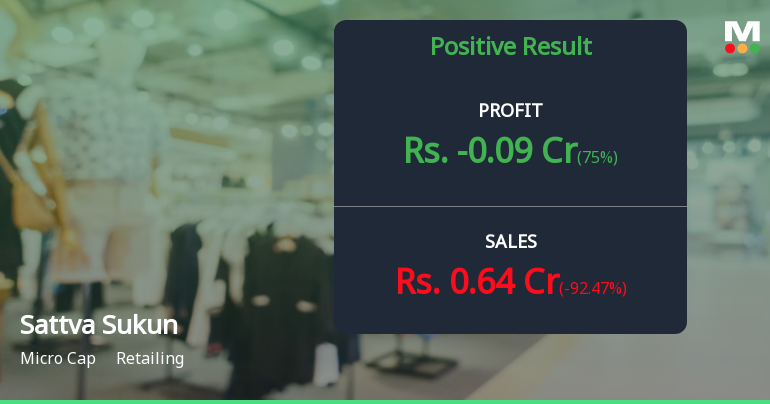
Sattva Sukun Lifecare Q1 FY27: Sharp Revenue Decline Triggers Loss as Turnaround Stalls
Sattva Sukun Lifecare Ltd., a micro-cap retailing company with a market capitalisation of ₹28.00 crores, reported a disappointing first quarter for FY2027, posting a consolidated net loss of ₹0.09 crores compared to a profit of ₹0.65 crores in Q1 FY26. This represents a sharp reversal from profitability, marking a 113.85% year-on-year decline. The company's shares closed at ₹0.74 on August 04, 2026, down 3.9% on the day, reflecting investor concerns about the deteriorating financial performance.
Read full news article Announcements
Announcement under Regulation 30 (LODR)-Newspaper Publication
05-Aug-2026 | Source : BSENewspaper publication of first quarter ended un-audited financial result .
Un-Audited Financial Results (Standalone And Consolidated) For The First Quarter Ended June 30 2026
04-Aug-2026 | Source : BSEFinancial Result
Board Meeting Outcome for Outcome Of Board Meeting
04-Aug-2026 | Source : BSEOutcome of board Meeting
Corporate Actions

No Upcoming Board Meetings

No Dividend history available

Sattva Sukun Lifecare Ltd has announced 1:5 stock split, ex-date: 25 Oct 24

Sattva Sukun Lifecare Ltd has announced 3:5 bonus issue, ex-date: 17 Jan 25

Sattva Sukun Lifecare Ltd has announced 5:2 rights issue, ex-date: 09 May 25
Key FactorsQuality key factors
Valuation key factors
Technicals key factors
 Technical Indicator Scale: Bearish, Mildly Bearish, Sideways, Mildly Bullish, Bullish Turned Shareholding
Shareholding Snapshot : Jun 2026
Shareholding Compare (%holding)
Non Institution
None
Held by 0 Schemes
Held by 0 FIIs
Roshan Dealmark Private Limited (6.37%)
L7 Hitech Private Limited (6.68%)
72.45%
FinancialQuarterly Results Snapshot (Consolidated) - Jun'26 - QoQ
 Compare with Peers
QoQ Growth in quarter ended Jun 2026 is -92.47% vs 49.38% in Mar 2026

QoQ Growth in quarter ended Jun 2026 is 75.00% vs 10.00% in Mar 2026

Half Yearly Results Snapshot (Consolidated) - Sep'25
Growth in half year ended Sep 2025 is 699.12% vs 115.24% in Sep 2024
Growth in half year ended Sep 2025 is 37.50% vs 174.29% in Sep 2024
Nine Monthly Results Snapshot (Consolidated) - Dec'25
YoY Growth in nine months ended Dec 2025 is 462.80% vs 64.20% in Dec 2024
YoY Growth in nine months ended Dec 2025 is -44.24% vs 126.03% in Dec 2024
Annual Results Snapshot (Consolidated) - Mar'26
YoY Growth in year ended Mar 2026 is 513.12% vs 48.17% in Mar 2025
YoY Growth in year ended Mar 2026 is -95.58% vs 109.24% in Mar 2025
 Company CV
About Sattva Sukun Lifecare Ltd

Company Coordinates










