
Compare Saul Centers, Inc. with Similar Stocks
Total Returns (Price + Dividend) 
Saul Centers, Inc. for the last several years.
Risk Adjusted Returns v/s
News

Saul Centers, Inc. Hits 52-Week Low at $29.16 Amid Declining Performance
Saul Centers, Inc. has reached a new 52-week low, reflecting a significant downturn in its stock performance over the past year. The company, with a market capitalization of USD 794 million, has faced challenges in financial metrics, including declining operating cash flow and net profit, alongside underperformance against market benchmarks.
Read full news article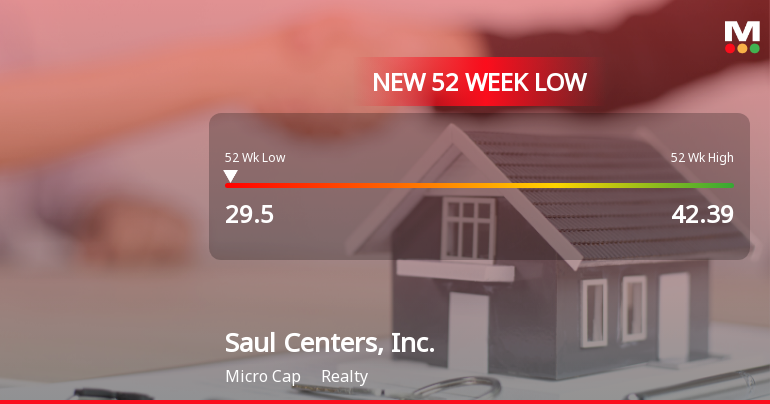
Saul Centers, Inc. Hits New 52-Week Low at $29.50
Saul Centers, Inc. has reached a new 52-week low, reflecting a significant downturn in its stock performance, which has declined over the past year. The company, with a market capitalization of USD 794 million, faces challenges in financial metrics, including reduced operating cash flow and net profit.
Read full news article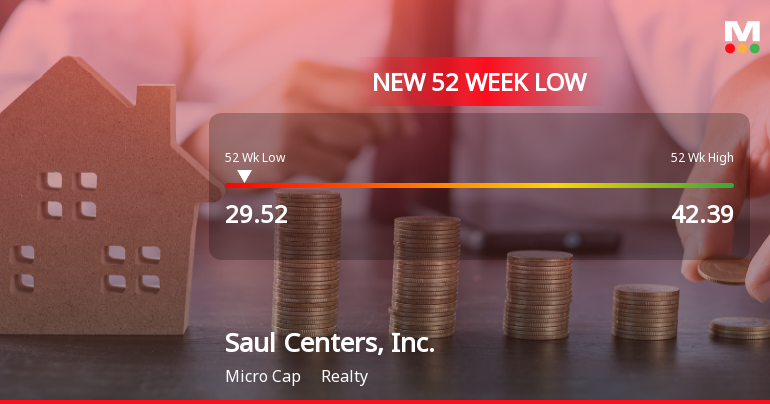
Saul Centers, Inc. Hits New 52-Week Low at $29.52
Saul Centers, Inc. has reached a new 52-week low of USD 29.52, reflecting a 16.91% decline over the past year. The company, with a market cap of USD 794 million, has faced challenges including stagnant sales growth and a decrease in operating cash flow, alongside a significant drop in net profit.
Read full news article Announcements

Corporate Actions
Quality key factors
Valuation key factors
Technicals key factors
 Technical Indicator Scale: Bearish, Mildly Bearish, Sideways, Mildly Bullish, Bullish Turned
 Shareholding Snapshot : Sep 2025
Shareholding Compare (%holding)
Domestic Funds
Held in 42 Schemes (24.37%)
Held by 81 Foreign Institutions (3.6%)
Quarterly Results Snapshot (Consolidated) - Jun'25 - QoQ

QoQ Growth in quarter ended Jun 2025 is -1.52% vs 5.71% in Mar 2025
QoQ Growth in quarter ended Jun 2025 is 10.94% vs 23.08% in Mar 2025
Annual Results Snapshot (Consolidated) - Dec'24
YoY Growth in year ended Dec 2024 is 4.66% vs 4.84% in Dec 2023
YoY Growth in year ended Dec 2024 is -1.88% vs 5.50% in Dec 2023
About Saul Centers, Inc.

Company Coordinates


