
Compare Saumya Cons with Similar Stocks
Dashboard
With a Operating Losses, the company has a Weak Long Term Fundamental Strength
- Poor long term growth as Net Sales has grown by an annual rate of -6.55% and Operating profit at -181.50%
The company has declared Negative results for the last 6 consecutive quarters
Risky - Negative EBITDA
Underperformed the market in the last 1 year
Stock DNA
Non Banking Financial Company (NBFC)
INR 82 Cr (Micro Cap)
NA (Loss Making)
21
0.00%
0.00
-3.47%
0.65
Total Returns (Price + Dividend) 
Saumya Cons for the last several years.
Risk Adjusted Returns v/s
Returns Beta

News
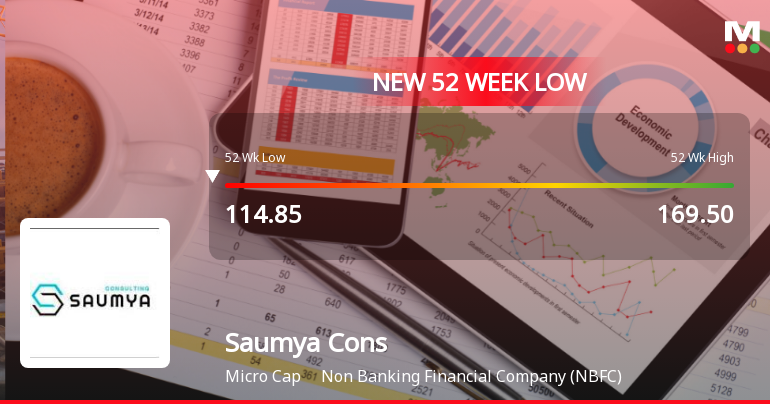
Markets Rally, But Saumya Consultants Ltd Sinks to 52-Week Low in Stock-Specific Sell-Off
Despite a broadly positive market environment, Saumya Consultants Ltd has slipped to a fresh 52-week low, closing just 1.59% above its lowest price of Rs 114.85 on 17 Jul 2026. This decline comes amid a sharp underperformance relative to the sector and the broader indices, signalling persistent headwinds for the micro-cap NBFC.
Read full news article
Saumya Consultants Ltd is Rated Strong Sell
Saumya Consultants Ltd is rated Strong Sell by MarketsMOJO. This rating was last updated on 03 Mar 2025, reflecting a significant reassessment of the stock’s outlook. However, the analysis and financial metrics discussed below are based on the company’s current position as of 09 July 2026, providing investors with the latest insights into its performance and prospects.
Read full news article
Saumya Consultants Ltd is Rated Strong Sell
Saumya Consultants Ltd is rated Strong Sell by MarketsMOJO, with this rating last updated on 03 Mar 2025. However, the analysis and financial metrics discussed here reflect the company’s current position as of 28 June 2026, providing investors with an up-to-date view of its fundamentals, valuation, financial trend, and technical outlook.
Read full news article Announcements
Compliances-Certificate under Reg. 74 (5) of SEBI (DP) Regulations 2018
08-Jul-2026 | Source : BSEpfa
Compliance-57 (5) : intimation after the end of quarter
01-Jul-2026 | Source : BSEpfa
Board Meeting Outcome for Outcome Of Board Meeting
29-Jun-2026 | Source : BSEDear Sirs / Madam Pursuant to Regulation 30 of the SEBI (Listing Obligations and Disclosure Requirements) Regulations 2015 we wish to inform you that the Board of Directors of the Company at its meeting held today June 29 2026 has approved the voluntary delisting of the Companys Equity Shares from The Calcutta Stock Exchange Limited (CSE). The Meeting of Board of Directors commenced at 11:00 AM and concluded at 11:20 AM. The decision has been taken in terms of the SEBI (Delisting of Equity Shares) Regulations as amended. The rationale for the voluntary delisting from CSE is due to negligible trading volume and to optimize administrative compliance costs.
Corporate Actions

No Upcoming Board Meetings

No Dividend history available

No Splits history available

No Bonus history available

No Rights history available
Quality key factors
Valuation key factors
Technicals key factors
 Technical Indicator Scale: Bearish, Mildly Bearish, Sideways, Mildly Bullish, Bullish Turned
 Shareholding Snapshot : Jun 2026
Shareholding Compare (%holding)
Promoters
None
Held by 0 Schemes
Held by 0 FIIs
Arun Kumar Agarwalla (24.21%)
Dhanverdhi Exports Limited (6.9%)
9.17%
Quarterly Results Snapshot (Standalone) - Mar'26 - QoQ

QoQ Growth in quarter ended Mar 2026 is -292.43% vs -3.65% in Dec 2025
QoQ Growth in quarter ended Mar 2026 is -1,330.56% vs 130.08% in Dec 2025
Half Yearly Results Snapshot (Standalone) - Sep'25
Growth in half year ended Sep 2025 is -65.11% vs 51.46% in Sep 2024
Growth in half year ended Sep 2025 is -67.98% vs 62.67% in Sep 2024
Nine Monthly Results Snapshot (Standalone) - Dec'25
YoY Growth in nine months ended Dec 2025 is -58.07% vs -2.86% in Dec 2024
YoY Growth in nine months ended Dec 2025 is -58.67% vs -0.05% in Dec 2024
Annual Results Snapshot (Standalone) - Mar'26
YoY Growth in year ended Mar 2026 is -75.75% vs -33.87% in Mar 2025
YoY Growth in year ended Mar 2026 is -147.45% vs -56.92% in Mar 2025
About Saumya Consultants Ltd

Company Coordinates


