
Compare Sawaca Enterpri. with Similar Stocks
Dashboard
With a Operating Losses, the company has a Weak Long Term Fundamental Strength
- Company's ability to service its debt is weak with a poor EBIT to Interest (avg) ratio of -0.86
- The company has reported losses. Due to this company has reported negative ROCE
Flat results in Mar 26
Risky - Negative EBITDA
Stock DNA
Diversified Commercial Services
INR 17 Cr (Micro Cap)
NA (Loss Making)
23
0.00%
0.04
-0.72%
0.31
Total Returns (Price + Dividend) 
Sawaca Enterpri. for the last several years.
Risk Adjusted Returns v/s
Returns Beta

News
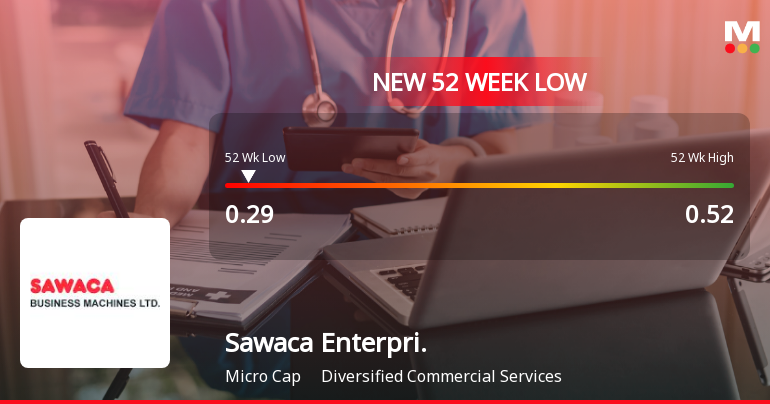
Sawaca Enterprises Ltd Falls to 52-Week Low of Rs 0.29 as Sell-Off Deepens
For the fifth consecutive session, Sawaca Enterprises Ltd closed lower, slipping to a fresh 52-week low of Rs 0.29 on 16 Jun 2026. This decline comes amid a broader market rally, with the Sensex trading 0.56% higher, highlighting a stark divergence in the stock's performance.
Read full news articleAre Sawaca Enterprises Ltd latest results good or bad?
Sawaca Enterprises Ltd's latest financial results for Q4 FY26 present a complex picture characterized by significant revenue growth alongside substantial operational challenges. The company reported net sales of ₹12.37 crores, reflecting an 8.22% sequential increase and a notable 28.05% year-on-year growth. This marks the highest quarterly revenue in recent periods, indicating some commercial traction. However, this revenue expansion has not translated into profitability, as the company incurred a net loss of ₹1.06 crores, which is a stark contrast to the positive net profit of ₹0.41 crores reported in the previous quarter (Q3 FY26). The operational metrics reveal a concerning trend, with the operating margin deteriorating to -2.83% from -0.44% in Q3 FY26, and the profit after tax (PAT) margin collapsing to -8.57% from a positive 3.59%. This indicates a significant erosion of profitability, raising questio...
Read full news article
Sawaca Enterprises Q4 FY26: Mounting Losses Signal Deepening Operational Crisis
Sawaca Enterprises Ltd., a micro-cap diversified commercial services company, reported a troubling fourth quarter for FY26, posting a net loss of ₹1.06 crores—a stark deterioration from the ₹0.41 crore profit recorded in Q3 FY26. The loss represents a sequential decline of 358.54% and a year-on-year worsening of 39.08% compared to the ₹1.74 crore loss in Q4 FY25. The company's stock, trading at ₹0.35 on the NSE with a market capitalisation of just ₹21.00 crores, has declined 2.78% following the results announcement, reflecting investor concerns about the deteriorating financial trajectory.
Read full news article Announcements
Announcement under Regulation 30 (LODR)-Newspaper Publication
30-May-2026 | Source : BSEEnclosed the newspaper publication of the Audited Financial Results for the Year and Quarter ended March 31 2026.
Audited Results For The Quarter And Year Ended March 31 2026
29-May-2026 | Source : BSEThe Audited Results and Audit Report for the Quarter and Year Ended March 31 2026 is enclosed.
Board Meeting Outcome for Meeting Held On 29Th May 2026
29-May-2026 | Source : BSEThe Outcome of Meeting held on 29th May 2026 is enclosed
Corporate Actions

No Upcoming Board Meetings

No Dividend history available

Sawaca Enterprises Ltd has announced 1:10 stock split, ex-date: 27 May 22

Sawaca Enterprises Ltd has announced 10:100 bonus issue, ex-date: 27 May 22

Sawaca Enterprises Ltd has announced 4:1 rights issue, ex-date: 07 Mar 24
Quality key factors
Valuation key factors
Technicals key factors
 Technical Indicator Scale: Bearish, Mildly Bearish, Sideways, Mildly Bullish, Bullish Turned
 Shareholding Snapshot : Mar 2026
Shareholding Compare (%holding)
Non Institution
None
Held by 0 Schemes
Held by 0 FIIs
Jyotsana Satishkumar Shah (0.37%)
None
94.67%
Quarterly Results Snapshot (Standalone) - Mar'26 - YoY

YoY Growth in quarter ended Mar 2026 is 28.05% vs 60.20% in Mar 2025

YoY Growth in quarter ended Mar 2026 is 39.08% vs -17,500.00% in Mar 2025
Half Yearly Results Snapshot (Standalone) - Sep'25
Growth in half year ended Sep 2025 is -70.48% vs 9,311.76% in Sep 2024
Growth in half year ended Sep 2025 is -69.23% vs 122.86% in Sep 2024
Nine Monthly Results Snapshot (Standalone) - Dec'25
YoY Growth in nine months ended Dec 2025 is -64.73% vs 14,133.33% in Dec 2024
YoY Growth in nine months ended Dec 2025 is -53.24% vs 208.89% in Dec 2024
Annual Results Snapshot (Standalone) - Mar'26
YoY Growth in year ended Mar 2026 is -53.84% vs 1,157.65% in Mar 2025
YoY Growth in year ended Mar 2026 is -17.14% vs -176.09% in Mar 2025
About Sawaca Enterprises Ltd

Company Coordinates


