
Compare Sayaji Industr with Similar Stocks
Dashboard
Weak Long Term Fundamental Strength with a -14.26% CAGR growth in Operating Profits over the last 5 years
- Low ability to service debt as the company has a high Debt to EBITDA ratio of 5.84 times
- The company has been able to generate a Return on Equity (avg) of 4.97% signifying low profitability per unit of shareholders funds
With a growth in Net Sales of 8.53%, the company declared Very Positive results in Mar 26
With ROCE of 5.8, it has a Expensive valuation with a 1.8 Enterprise value to Capital Employed
Majority shareholders : Promoters
Market Beating performance in long term as well as near term
Stock DNA
Other Agricultural Products
INR 335 Cr (Micro Cap)
243.00
24
0.00%
2.42
1.49%
3.61
Total Returns (Price + Dividend) 
Latest dividend: 1 per share ex-dividend date: Jul-29-2022
Risk Adjusted Returns v/s
Returns Beta

News
Sayaji Industries Ltd is Rated Hold by MarketsMOJO
Sayaji Industries Ltd is rated 'Hold' by MarketsMOJO, with this rating last updated on 05 May 2026. However, the analysis and financial metrics discussed here reflect the company’s current position as of 11 June 2026, providing investors with the latest insights into its performance and outlook.
Read full news article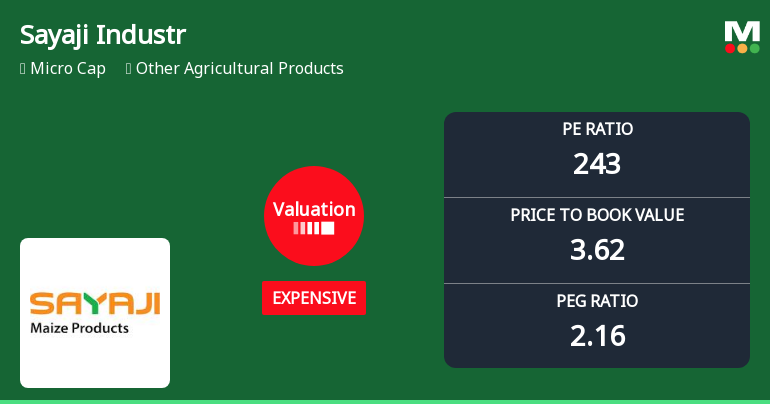
Sayaji Industries Ltd Valuation Shifts Amid Strong Returns and Sector Comparison
Sayaji Industries Ltd, a micro-cap player in the Other Agricultural Products sector, has experienced a notable shift in its valuation parameters, moving from a very expensive to an expensive rating. This change, coupled with its elevated price-to-earnings (P/E) ratio and price-to-book value (P/BV), warrants a detailed analysis of its price attractiveness relative to historical levels and peer comparisons.
Read full news article
Sayaji Industries Ltd is Rated Hold by MarketsMOJO
Sayaji Industries Ltd is rated 'Hold' by MarketsMOJO, a rating that was last updated on 05 May 2026. While this rating change occurred earlier this month, the analysis and financial metrics discussed here reflect the company’s current position as of 29 May 2026, providing investors with the most up-to-date insight into the stock’s performance and outlook.
Read full news article Announcements
Submission Of Investor Presentation For Q4 And FY2025-26.
03-Jun-2026 | Source : BSEPlease find herewith Investor Presentation for Q4 and FY 2025-26 of the company.
Intimation Under Regulation 30 Of SEBI (LODR) Regulations 2015.
02-Jun-2026 | Source : BSEIntimation under Regulation 30 of SEBI (LODR) Regulations 2015 relating to GO Live of SAP.
Compliances-Reg.24(A)-Annual Secretarial Compliance
29-May-2026 | Source : BSEPlease find attached herewith Annual Secretarial Compliance Report under Regulation 24A of SEBI (LODR) 2015 for the year ended 31st March 2026.
Corporate Actions

No Upcoming Board Meetings

Sayaji Industries Ltd has declared 20% dividend, ex-date: 29 Jul 22

Sayaji Industries Ltd has announced 5:10 stock split, ex-date: 27 Dec 18

Sayaji Industries Ltd has announced 3:1 bonus issue, ex-date: 07 Oct 25

No Rights history available
Quality key factors
Valuation key factors
Technicals key factors
 Technical Indicator Scale: Bearish, Mildly Bearish, Sideways, Mildly Bullish, Bullish Turned
 Shareholding Snapshot : Mar 2026
Shareholding Compare (%holding)
Promoters
None
Held by 0 Schemes
Held by 0 FIIs
Varun Family Trust (16.93%)
Sayaji Industries Limited (3.72%)
18.11%
Quarterly Results Snapshot (Consolidated) - Mar'26 - YoY

YoY Growth in quarter ended Mar 2026 is 8.53% vs -7.00% in Mar 2025
YoY Growth in quarter ended Mar 2026 is 241.60% vs 1.15% in Mar 2025
Half Yearly Results Snapshot (Consolidated) - Sep'25
Growth in half year ended Sep 2025 is 6.80% vs 4.91% in Sep 2024

Growth in half year ended Sep 2025 is -466.96% vs -17.95% in Sep 2024
Nine Monthly Results Snapshot (Consolidated) - Dec'25
YoY Growth in nine months ended Dec 2025 is 6.18% vs 6.63% in Dec 2024
YoY Growth in nine months ended Dec 2025 is -175.29% vs 10.77% in Dec 2024
Annual Results Snapshot (Consolidated) - Mar'26
YoY Growth in year ended Mar 2026 is 6.75% vs 2.93% in Mar 2025
YoY Growth in year ended Mar 2026 is 112.22% vs 4.43% in Mar 2025
About Sayaji Industries Ltd

Company Coordinates


