SBC Exports

  • Market Cap: Micro Cap
  • Industry: Garments & Apparels
  • ISIN: INE04AK01028
  • NSEID: SBC
  • BSEID: 542725
INR
41.48
1.35 (3.36%)
BSENSE

Aug 27, 03:13 PM

BSE+NSE Vol: 86.42 lacs

  • Price Points
  • Score
  • Mojo Parameters
  • Total Return
  • News and Corporate Actions
  • Key factors
  • Shareholding
  • Financials
  • CompanyCV
stock-summaryPrice Point
High/Low

1Day

52 Week

Valuation
Technical
Day's Volume

CASH

86.42 lacs (32.13%) Volume

Shareholding (Jun 2026)

FII

2.79%

Held by 6 FIIs

DII

0.08%

Held by 1 DIIs

Promoter

50.28%

Why is SBC Exports Ltd falling/rising?

27-Aug-2026

As of 26-Aug, SBC Exports Ltd's stock price is rising to 40.09, with a notable year-to-date increase of 42.31%, significantly outperforming the Sensex. Despite a recent decline in investor participation, the stock's strong historical performance supports its upward trend.

As of 26-Aug, SBC Exports Ltd's stock price is rising, currently at 40.09, with a change of 0.19 (0.48%) upward. The stock has shown a positive performance today, outperforming its sector by 0.44%. Additionally, it has been gaining for the last two days, with a total return of 0.93% during this period. <BR><BR>In terms of longer-term performance, the stock has significantly outperformed the benchmark Sensex over various time frames, including a remarkable year-to-date increase of 42.31% compared to the Sensex's decline of 9.09%. Over the past year, SBC Exports Ltd has increased by 113.24%, while the Sensex has fallen by 4.10%. This trend continues over three and five years, where the stock has risen by 306.18% and 4164.89%, respectively, against the Sensex's much lower gains.<BR><BR>However, it is important to note that there has been a decline in investor participation, with delivery volume dropping by 60.54% against the five-day average. Despite this, the stock remains liquid enough for trading, indicating that while there may be some caution among investors, the overall upward trend in price is supported by strong historical performance and recent gains.

View full answer

Should I buy, sell or hold SBC Exports Ltd?

14-Aug-2026

Who are in the management team of SBC Exports?

14-Aug-2026

The management team of SBC Exports includes Deepika Gupta (Whole-time Director), Govindji Gupta (Managing Director), and several Independent Directors: Akshat Gupta, Vinod Kumar, Manupriya Mishra, Amit Jaiswal, and Manish Gupta, along with Hari Om Sharma as Company Secretary.

The management team of SBC Exports includes the following individuals:<BR><BR>1. Deepika Gupta - Whole-time Director<BR>2. Govindji Gupta - Managing Director<BR>3. Akshat Gupta - Independent Director<BR>4. Vinod Kumar - Independent Director<BR>5. Manupriya Mishra - Independent Director<BR>6. Amit Jaiswal - Independent Director<BR>7. Manish Gupta - Independent Director<BR>8. Hari Om Sharma - Company Secretary<BR><BR>If you need more specific information about any of these individuals or their roles, feel free to ask!

View full answer

What does SBC Exports do?

14-Aug-2026

SBC Exports Ltd is a Micro Cap company involved in garment trading and manufacturing, as well as manpower supply and tour operator services. As of June 2026, it reported net sales of 121 Cr and a net profit of 10 Cr.

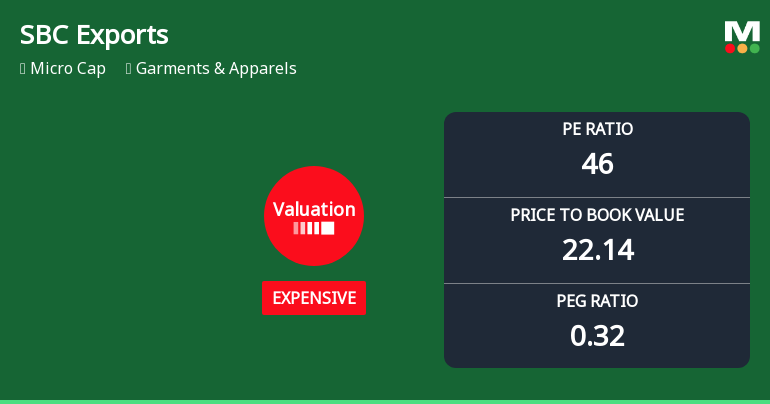
Overview: <BR>SBC Exports Ltd is engaged in the trading and manufacturing of garments, as well as providing manpower supply services and tour operator services, operating within the Garments & Apparels industry and classified as a Micro Cap company.<BR><BR>History: <BR>SBC Exports Limited was incorporated as a Public Limited Company on January 18, 2011, in Uttar Pradesh. The Certificate of Commencement of Business was issued on February 23, 2011. The latest quarterly results reported net sales and net profit for June 2026.<BR><BR>Financial Snapshot: <BR>Net Sales: 121 Cr (Quarterly Results - Jun 2026) <BR>Net Profit: 10 Cr (Quarterly Results - Jun 2026) <BR>Market Cap: INR 1,924 Cr (Micro Cap)<BR><BR>Key Metrics: <BR>P/E: 46.00 <BR>Industry P/E: 28 <BR>Dividend Yield: 0.00% <BR>Debt-Equity: 2.61 <BR>Return on Equity: 42.72% <BR>Price to Book: 23.95<BR><BR>Contact Details: <BR>Details: No Company Details Available <BR>Registrar Address: Not available.

View full answer

Who are the peers of the SBC Exports?

14-Aug-2026

Peers of SBC Exports include Baazar Style, Kitex Garments, Sportking India, SP Apparels, Bombay Dyeing, Cantabil Retail, Aayush Art, Go Fashion (I), and Dollar Industrie. SBC Exports has the highest 1-year return at 103.55%, while Go Fashion (I) has the lowest at -52.08%.

Peers: The peers of SBC Exports are Baazar Style, Kitex Garments, Sportking India, SP Apparels, Bombay Dyeing, Cantabil Retail, Aayush Art, Go Fashion (I), and Dollar Industrie.<BR><BR>Quality Snapshot: Excellent management risk is observed at Aayush Art and Baazar Style, while Below Average management risk is found at Kitex Garments and the rest. Growth is Excellent at Baazar Style and Cantabil Retail, while Good growth is noted at SBC Exports, and Below Average growth is seen at Kitex Garments, Sportking India, SP Apparels, Bombay Dyeing, Go Fashion (I), and Dollar Industrie. Capital Structure is Good at Aayush Art and SP Apparels, Average at Kitex Garments, Sportking India, Cantabil Retail, and Go Fashion (I), while Below Average is noted at Baazar Style, Bombay Dyeing, SBC Exports, and Dollar Industrie.<BR><BR>Return Snapshot: The peer with the highest 1-year return is SBC Exports at 103.55%, while the lowest is Go Fashion (I) at -52.08%. SBC Exports' 1-year return significantly outperforms all peers. Additionally, the six-month return is negative for Cantabil Retail, Go Fashion (I), and Dollar Industrie.

View full answer

How big is SBC Exports?

14-Aug-2026

As of 14th August, SBC Exports Ltd has a market capitalization of 1,832.38 Cr, with recent net sales of 451.83 Cr and a net profit of 38.25 Cr.

As of 14th August, SBC Exports Ltd has a market capitalization of 1,832.38 Cr and is classified as a Micro Cap company.<BR><BR>In the latest four quarters, SBC Exports reported Net Sales of 451.83 Cr and a Net Profit of 38.25 Cr.<BR><BR>The latest annual period for the balance sheet is March 2025, with Shareholder's Funds amounting to 55.61 Cr and Total Assets valued at 271.39 Cr.

View full answer

Are SBC Exports Ltd latest results good or bad?

12-Aug-2026

SBC Exports Ltd's latest results show strong revenue growth with net sales up 47.04% year-on-year, but profitability is concerning due to a 26.61% decline in net profit quarter-on-quarter and a drop in operating margins to 4.17%. The reliance on other income for 71.17% of profits raises questions about the sustainability of earnings, suggesting investors should proceed with caution.

SBC Exports Ltd's latest results present a mixed picture. On one hand, the company achieved impressive revenue growth, with net sales reaching ₹141.60 crores in Q4 FY26, marking a 47.04% increase year-on-year and a 35.57% increase quarter-on-quarter. This performance reflects a strong upward trend in sales, sustained over several quarters.<BR><BR>However, the profitability aspect raises concerns. The net profit for the same quarter was ₹8.22 crores, which, despite being a significant 104.99% increase year-on-year, represents a sharp decline of 26.61% compared to the previous quarter. More troubling is the operating margin, which fell to just 4.17%, the lowest in five quarters, down from 11.31% in Q3 FY26. This indicates that while the company is generating more sales, it is facing significant cost pressures that are eroding profitability.<BR><BR>Additionally, a substantial portion of the profit before tax—71.17%—came from other income, raising questions about the sustainability and quality of the earnings generated from core operations. The reliance on non-operating income to bolster profits suggests potential vulnerabilities in the business model.<BR><BR>In summary, while SBC Exports Ltd has demonstrated strong revenue growth, the significant decline in operating margins and the heavy reliance on other income for profitability point to underlying challenges that could affect future performance. Investors should be cautious and monitor these trends closely.

View full answer

When is the next results date for SBC Exports Ltd?

07-Aug-2026

The next results date for SBC Exports Ltd is 12 August 2026.

The next results date for SBC Exports Ltd is scheduled for 12 August 2026.

View full answer

Is SBC Exports overvalued or undervalued?

11-Nov-2025

As of November 10, 2025, SBC Exports is considered very expensive and overvalued with a PE Ratio of 53.39, significantly higher than its peers, and despite a strong year-to-date stock performance of 41.53%, its low ROE of 3.19% suggests that this premium valuation may not be justified by its financial fundamentals.

As of 10 November 2025, SBC Exports has moved from an expensive to a very expensive valuation grade. The company is currently considered overvalued based on its high valuation metrics. Key ratios include a PE Ratio of 53.39, an EV to EBITDA of 126.70, and a ROE of 3.19%. <BR><BR>When compared to peers, SBC Exports' PE Ratio significantly exceeds that of K P R Mill Ltd at 42.57 and Trident at 32.65, indicating a premium valuation that may not be justified by its financial performance. Additionally, the company's recent stock performance has outpaced the Sensex, with a year-to-date return of 41.53% compared to the Sensex's 6.91%, which may further reflect speculative interest rather than fundamental strength.

View full answer

How has been the historical performance of SBC Exports?

09-Nov-2025

SBC Exports has experienced significant growth in net sales and profitability, with net sales rising from 129.87 Cr in Mar'21 to 300.05 Cr in Mar'25, and profit after tax increasing from 1.84 Cr to 13.37 Cr during the same period. However, the company has also seen a substantial rise in liabilities and negative cash flow from operations.

Answer:<BR>The historical performance of SBC Exports shows significant growth in net sales and profitability over the years.<BR><BR>Breakdown:<BR>SBC Exports has demonstrated a strong upward trend in net sales, increasing from 129.87 Cr in Mar'21 to 300.05 Cr in Mar'25. This growth is accompanied by a rise in total operating income, which mirrors net sales, reaching 300.05 Cr in Mar'25. The company's total expenditure has also increased, from 125.72 Cr in Mar'21 to 281.86 Cr in Mar'25, primarily driven by higher raw material costs and purchases of finished goods. Operating profit, excluding other income, has improved from 4.15 Cr in Mar'21 to 18.19 Cr in Mar'25, while the overall operating profit, including other income, rose to 27.18 Cr in Mar'25. Profit before tax has similarly increased, reaching 18.35 Cr in Mar'25, up from 2.54 Cr in Mar'21. Consequently, profit after tax has grown from 1.84 Cr in Mar'21 to 13.37 Cr in Mar'25, reflecting a healthy PAT margin of 4.46% in the latest year. The company's total assets have expanded significantly from 96.84 Cr in Mar'22 to 271.39 Cr in Mar'25, with total liabilities also rising to 271.39 Cr, indicating a substantial increase in debt from 9.42 Cr in Mar'22 to 136.27 Cr in Mar'25. Cash flow from operating activities has been negative in recent years, culminating in -69.00 Cr in Mar'25, although net cash inflow improved to 7.00 Cr in the same period. Overall, SBC Exports has shown robust growth in sales and profits, despite increasing liabilities and negative cash flow from operations.

View full answer

Is SBC Exports technically bullish or bearish?

03-Sep-2025

As of September 2, 2025, the trend is bullish with strong indicators like daily moving averages and MACD supporting this view, although the weekly RSI suggests caution in the short term.

As of 2 September 2025, the technical trend has changed from mildly bullish to bullish. The current stance is bullish with strong indicators supporting this view. The daily moving averages are bullish, and the weekly MACD is also bullish, contributing to the overall positive sentiment. Additionally, the Bollinger Bands on both weekly and monthly time frames are bullish, indicating strong price momentum. The On-Balance Volume (OBV) is bullish on both weekly and monthly charts, reinforcing the strength of the bullish trend. However, the weekly RSI is bearish, which suggests some caution may be warranted in the short term. Overall, the bullish trend is supported by multiple indicators, despite some mixed signals in the shorter time frames.

View full answer

Who are the top shareholders of the SBC Exports?

06-Jun-2025

The top shareholders of SBC Exports include promoter Deepika Gupta with 28.53% ownership, while pledged promoter holdings are at 30.92%. Public shareholders, including Sbc Infotech Limited and individual investors, hold 1.72% and 32.76%, respectively, with foreign institutional investors owning 0.16% and no mutual funds involved.

The top shareholders of SBC Exports primarily consist of promoters, with Deepika Gupta being the promoter with the highest holding at 28.53%. The pledged promoter holdings stand at 30.92%. In terms of public shareholders, Sbc Infotech Limited holds 1.72%. Additionally, individual investors collectively hold 32.76% of the shares. There are also three foreign institutional investors (FIIs) that hold a small portion of 0.16%, but no mutual funds are currently involved with the company.

View full answer

What is the bonus history of the SBC Exports?

06-Jun-2025

SBC Exports has a history of issuing bonus shares, with the most recent being a 1:2 bonus announced on March 10, 2025, following another 1:2 bonus on January 19, 2024, and a 1:1 bonus on February 22, 2022. This demonstrates the company's commitment to rewarding its shareholders.

SBC Exports has a notable bonus history. The most recent bonus issue was announced as a 1:2 bonus, with an ex-date of March 10, 2025. Prior to that, on January 19, 2024, the company issued another 1:2 bonus. Additionally, on February 22, 2022, SBC Exports had a bonus issue with a ratio of 1:1. This reflects the company's commitment to rewarding its shareholders through bonus shares over the years.

View full answer

Has SBC Exports declared dividend?

06-Jun-2025

SBC Exports Ltd has declared a 5% dividend, amounting to 0.05 per share, with an ex-date of September 23, 2024. Recent total returns show volatility, with negative returns in the short term but significant positive returns over longer periods.

SBC Exports Ltd has declared a 5% dividend.<BR><BR>Dividend Details:<BR>- Percentage announced: 5%<BR>- Amount per share: 0.05<BR>- Ex-date: 23 Sep 24<BR><BR>Dividend Yield: 0.22%.<BR><BR>Total Returns by Period:<BR>In the last 6 months, the price return was -18.63%, with a dividend return of 0%, resulting in a total return of -18.63%.<BR><BR>Over the past year, the price return was -25.77%, with a dividend return of 0.26%, leading to a total return of -25.51%.<BR><BR>In the 2-year period, the price return was 57.72%, the dividend return was 1.15%, culminating in a total return of 58.87%.<BR><BR>For the 3-year period, the price return was 525.94%, the dividend return was 4.37%, resulting in a total return of 530.31%.<BR><BR>In the last 4 years, the price return was 1464.86%, with a dividend return of 10.75%, leading to a total return of 1475.61%.<BR><BR>Over the 5-year period, the price return was 2645.58%, the dividend return was 15.62%, resulting in a total return of 2661.2%.<BR><BR>Overall, SBC Exports Ltd has declared a dividend, but the recent total returns indicate significant volatility, with negative returns in the short term contrasted by substantial positive returns over longer periods.

View full answer
iScoreScore
Click here to find our call on this stock
Strong Sell
Sell
Hold
Buy
Strong Buy

Dashboard

1

Healthy long term growth as Operating profit has grown by an annual rate 48.69%

 
2

The company has declared Positive results for the last 4 consecutive quarters

3

With ROCE of 10.9, it has a Very Expensive valuation with a 7.3 Enterprise value to Capital Employed

4

39.98% of Promoter Shares are Pledged

5

Market Beating performance in long term as well as near term

stock-summaryMojo Parameters

Mojo Parameters

Loading Valuation Snapshot...

Stock DNA

stock-summary
Industry

Garments & Apparels

stock-summary
Market cap

INR 1,975 Cr (Micro Cap)

stock-summary
P/E

50.00

stock-summary
Industry P/E

NA

stock-summary
Dividend Yield

0.00%

stock-summary
Debt Equity

2.61

stock-summary
Return on Equity

38.98%

stock-summary
Price to Book

23.84

Revenue and Profits:
Net Sales:
121 Cr
(Quarterly Results - Jun 2026)
Net Profit:
10 Cr
stock-summaryTotal Returns
Total Returns (Price + Dividend) stock-summary
Dividend Yield (0%)
TimePeriod
Price Return
Dividend Return
Total Return
3 Months
3.99%
0%
3.99%
6 Months
28.66%
0%
28.66%
1 Year
120.29%
0%
120.29%
2 Years
103.43%
0.14%
103.57%
3 Years
318.57%
0.59%
319.16%
4 Years
1180.25%
1.45%
1181.7%
5 Years
0%
0%
0.0%

Latest dividend: 0.03333333333333333 per share ex-dividend date: Sep-23-2024

Risk Adjusted Returns v/s stock-summary
Returns Beta
Icon
Beta has not been calculated since enough price history is not available
stock-summaryNews & Corporate Actions

News

stock-summaryKey Factors

Quality key factors stock-summary

Factor
Value
Sales Growth (5y)
23.07%
EBIT Growth (5y)
48.69%
EBIT to Interest (avg)
3.33
Debt to EBITDA (avg)
4.86
Net Debt to Equity (avg)
2.61
Sales to Capital Employed (avg)
3.41
Tax Ratio
12.13%
Dividend Payout Ratio
0
Pledged Shares
39.98%
Institutional Holding
2.87%
ROCE (avg)
19.58%
ROE (avg)
32.06%

Valuation key factors

Factor
Value
P/E Ratio
50
Industry P/E
26
Price to Book Value
23.84
EV to EBIT
54.11
EV to EBITDA
51.58
EV to Capital Employed
7.33
EV to Sales
4.69
PEG Ratio
0.35
Dividend Yield
NA
ROCE (Latest)
10.94%
ROE (Latest)
38.98%

Technicals key factors

Indicator
Weekly
Monthly
MACD
Mildly Bearish
Bullish
RSI
No Signal
No Signal
Bollinger Bands
Bullish
Mildly Bullish
Moving Averages
Mildly Bullish (Daily)
KST
Mildly Bearish
Bullish
Dow Theory
Mildly Bullish
Mildly Bullish
OBV
No Trend
Bullish
stock-summary Technical Indicator Scale: Bearish, Mildly Bearish, Sideways, Mildly Bullish, Bullish  Turned 
stock-summaryShareholding
Shareholding Snapshot : Jun 2026stock-summary
Shareholding Compare (%holding) stock-summary
Majority shareholders

Promoters

Pledged Promoter Holdings

39.9762

Mutual Funds

Held by 0 Schemes

FIIs

Held by 6 FIIs (2.79%)

Promoter with highest holding

Deepika Gupta (23.44%)

Highest Public shareholder

Quadrature Capital Vector Sp Limited (2%)

Individual Investors Holdings

33.1%

stock-summaryFinancial
[
  {
    "link": "quarterly",
    "btn_text": "All Quarterly Results",
    "header": "Quarterly Results Snapshot (Consolidated) - Jun'26 - QoQ",
    "rhs": [
      {
        "prefix": "Net Sales ",
        "suffix": "QoQ Growth in quarter ended Jun 2026 is -14.49% vs 35.57% in Mar 2026",
        "dir": -1
      },
      {
        "prefix": "Consolidated Net Profit ",
        "suffix": "QoQ Growth in quarter ended Jun 2026 is 57.89% vs -45.71% in Mar 2026",
        "dir": 1
      }
    ],
    "table": {
      "header": [
        "Jun'26",
        "Mar'26",
        "Change(%)"
      ],
      "body": [
        {
          "field": "Net Sales",
          "val1": "121.08",
          "val2": "141.60",
          "chgp": "-14.49%",
          "chgp_class": "negative"
        },
        {
          "field": "Operating Profit (PBDIT) excl Other Income",
          "val1": "13.12",
          "val2": "5.91",
          "chgp": "122.00%",
          "chgp_class": "positive"
        },
        {
          "field": "Interest",
          "val1": "3.63",
          "val2": "3.04",
          "chgp": "19.41%",
          "chgp_class": "negative"
        },
        {
          "field": "Exceptional Items",
          "val1": "0.00",
          "val2": "0.00",
          "chgp": "",
          "chgp_class": "neutral"
        },
        {
          "field": "Consolidate Net Profit",
          "val1": "9.60",
          "val2": "6.08",
          "chgp": "57.89%",
          "chgp_class": "positive"
        },
        {
          "field": "Operating Profit Margin (Excl OI)",
          "val1": "10.84%",
          "val2": "4.17%",
          "chgp": "6.67%",
          "chgp_class": "positive"
        }
      ]
    }
  },
  {
    "link": "half-yearly",
    "btn_text": "All Half Yearly Results",
    "header": "Half Yearly Results Snapshot (Consolidated) - Sep'25",
    "rhs": [
      {
        "prefix": "Net Sales ",
        "suffix": " Growth in half year ended Sep 2025 is 19.32% vs 49.53% in Sep 2024",
        "dir": -1
      },
      {
        "prefix": "Consolidated Net Profit ",
        "suffix": " Growth in half year ended Sep 2025 is 38.86% vs 57.99% in Sep 2024",
        "dir": -1
      }
    ],
    "table": {
      "header": [
        "Sep'25",
        "Sep'24",
        "Change(%)"
      ],
      "body": [
        {
          "field": "Net Sales",
          "val1": "157.15",
          "val2": "131.71",
          "chgp": "19.32%",
          "chgp_class": "positive"
        },
        {
          "field": "Operating Profit (PBDIT) excl Other Income",
          "val1": "15.71",
          "val2": "11.80",
          "chgp": "33.14%",
          "chgp_class": "positive"
        },
        {
          "field": "Interest",
          "val1": "4.34",
          "val2": "3.69",
          "chgp": "17.62%",
          "chgp_class": "negative"
        },
        {
          "field": "Exceptional Items",
          "val1": "0.00",
          "val2": "0.00",
          "chgp": "",
          "chgp_class": "neutral"
        },
        {
          "field": "Consolidate Net Profit",
          "val1": "14.83",
          "val2": "10.68",
          "chgp": "38.86%",
          "chgp_class": "positive"
        },
        {
          "field": "Operating Profit Margin (Excl OI)",
          "val1": "10.00%",
          "val2": "8.96%",
          "chgp": "1.04%",
          "chgp_class": "positive"
        }
      ]
    }
  },
  {
    "link": "nine-monthly",
    "btn_text": "All Nine Monthly Results",
    "header": "Nine Monthly Results Snapshot (Consolidated) - Dec'25",
    "rhs": [
      {
        "prefix": "Net Sales ",
        "suffix": "YoY Growth in nine months ended Dec 2025 is 28.39% vs 45.49% in Dec 2024",
        "dir": -1
      },
      {
        "prefix": "Consolidated Net Profit ",
        "suffix": "YoY Growth in nine months ended Dec 2025 is 81.52% vs 48.91% in Dec 2024",
        "dir": 1
      }
    ],
    "table": {
      "header": [
        "Dec'25",
        "Dec'24",
        "Change(%)"
      ],
      "body": [
        {
          "field": "Net Sales",
          "val1": "261.60",
          "val2": "203.75",
          "chgp": "28.39%",
          "chgp_class": "positive"
        },
        {
          "field": "Operating Profit (PBDIT) excl Other Income",
          "val1": "27.52",
          "val2": "13.63",
          "chgp": "101.91%",
          "chgp_class": "positive"
        },
        {
          "field": "Interest",
          "val1": "8.06",
          "val2": "5.53",
          "chgp": "45.75%",
          "chgp_class": "negative"
        },
        {
          "field": "Exceptional Items",
          "val1": "0.00",
          "val2": "0.00",
          "chgp": "",
          "chgp_class": "neutral"
        },
        {
          "field": "Consolidate Net Profit",
          "val1": "26.03",
          "val2": "14.34",
          "chgp": "81.52%",
          "chgp_class": "positive"
        },
        {
          "field": "Operating Profit Margin (Excl OI)",
          "val1": "10.52%",
          "val2": "6.69%",
          "chgp": "3.83%",
          "chgp_class": "positive"
        }
      ]
    }
  },
  {
    "link": "annual",
    "btn_text": "All Annual Results",
    "header": "Annual Results Snapshot (Consolidated) - Mar'26",
    "rhs": [
      {
        "prefix": "Net Sales ",
        "suffix": "YoY Growth in year ended Mar 2026 is 34.38% vs 43.28% in Mar 2025",
        "dir": -1
      },
      {
        "prefix": "Consolidated Net Profit ",
        "suffix": "YoY Growth in year ended Mar 2026 is 89.01% vs 41.48% in Mar 2025",
        "dir": 1
      }
    ],
    "table": {
      "header": [
        "Mar'26",
        "Mar'25",
        "Change(%)"
      ],
      "body": [
        {
          "field": "Net Sales",
          "val1": "403.21",
          "val2": "300.05",
          "chgp": "34.38%",
          "chgp_class": "positive"
        },
        {
          "field": "Operating Profit (PBDIT) excl Other Income",
          "val1": "33.43",
          "val2": "18.19",
          "chgp": "83.78%",
          "chgp_class": "positive"
        },
        {
          "field": "Interest",
          "val1": "11.10",
          "val2": "7.22",
          "chgp": "53.74%",
          "chgp_class": "negative"
        },
        {
          "field": "Exceptional Items",
          "val1": "0.00",
          "val2": "0.00",
          "chgp": "",
          "chgp_class": "neutral"
        },
        {
          "field": "Consolidate Net Profit",
          "val1": "25.27",
          "val2": "13.37",
          "chgp": "89.01%",
          "chgp_class": "positive"
        },
        {
          "field": "Operating Profit Margin (Excl OI)",
          "val1": "8.29%",
          "val2": "6.06%",
          "chgp": "2.23%",
          "chgp_class": "positive"
        }
      ]
    }
  }
]

Quarterly Results Snapshot (Consolidated) - Jun'26 - QoQstock-summary

Jun'26
Mar'26
Change(%)
Net Sales
121.08
141.60
-14.49%
Operating Profit (PBDIT) excl Other Income
13.12
5.91
122.00%
Interest
3.63
3.04
19.41%
Exceptional Items
0.00
0.00
Consolidate Net Profit
9.60
6.08
57.89%
Operating Profit Margin (Excl OI)
10.84%
4.17%
6.67%
Values in Rs Cr.
Direction Arrows
Net Sales

QoQ Growth in quarter ended Jun 2026 is -14.49% vs 35.57% in Mar 2026

Direction Arrows
Consolidated Net Profit

QoQ Growth in quarter ended Jun 2026 is 57.89% vs -45.71% in Mar 2026

Half Yearly Results Snapshot (Consolidated) - Sep'25stock-summary

Sep'25
Sep'24
Change(%)
Net Sales
157.15
131.71
19.32%
Operating Profit (PBDIT) excl Other Income
15.71
11.80
33.14%
Interest
4.34
3.69
17.62%
Exceptional Items
0.00
0.00
Consolidate Net Profit
14.83
10.68
38.86%
Operating Profit Margin (Excl OI)
10.00%
8.96%
1.04%
Values in Rs Cr.
Direction Arrows
Net Sales

Growth in half year ended Sep 2025 is 19.32% vs 49.53% in Sep 2024

Direction Arrows
Consolidated Net Profit

Growth in half year ended Sep 2025 is 38.86% vs 57.99% in Sep 2024

Nine Monthly Results Snapshot (Consolidated) - Dec'25stock-summary

Dec'25
Dec'24
Change(%)
Net Sales
261.60
203.75
28.39%
Operating Profit (PBDIT) excl Other Income
27.52
13.63
101.91%
Interest
8.06
5.53
45.75%
Exceptional Items
0.00
0.00
Consolidate Net Profit
26.03
14.34
81.52%
Operating Profit Margin (Excl OI)
10.52%
6.69%
3.83%
Values in Rs Cr.
Direction Arrows
Net Sales

YoY Growth in nine months ended Dec 2025 is 28.39% vs 45.49% in Dec 2024

Direction Arrows
Consolidated Net Profit

YoY Growth in nine months ended Dec 2025 is 81.52% vs 48.91% in Dec 2024

Annual Results Snapshot (Consolidated) - Mar'26stock-summary

Mar'26
Mar'25
Change(%)
Net Sales
403.21
300.05
34.38%
Operating Profit (PBDIT) excl Other Income
33.43
18.19
83.78%
Interest
11.10
7.22
53.74%
Exceptional Items
0.00
0.00
Consolidate Net Profit
25.27
13.37
89.01%
Operating Profit Margin (Excl OI)
8.29%
6.06%
2.23%
Values in Rs Cr.
Direction Arrows
Net Sales

YoY Growth in year ended Mar 2026 is 34.38% vs 43.28% in Mar 2025

Direction Arrows
Consolidated Net Profit

YoY Growth in year ended Mar 2026 is 89.01% vs 41.48% in Mar 2025

stock-summaryCompany CV
About SBC Exports Ltd stock-summary
stock-summary
SBC Exports Ltd
Micro Cap
Garments & Apparels
SBC Exports Limited was initially incorporated as a Public Limited Company on January 18, 2011 at Uttar Pradesh and Later on, the Certificate of Commencement of Business was issued on 23rd February, 2011 by the Registrar of Companies, Uttar Pradesh and Uttarakhand. The Company is engaged in the Trading and Manufacturing of Garments, Manpower Supply Services & Tour Operator Service.
Company Coordinates stock-summary
Icon
No Company Details Available