
Compare SBEC Sugar with Similar Stocks
Dashboard
Weak Long Term Fundamental Strength with a -214.01% CAGR growth in Operating Profits over the last 5 years
- Low ability to service debt as the company has a high Debt to EBITDA ratio of -57.20 times
- The company has been able to generate a Return on Equity (avg) of 2.23% signifying low profitability per unit of shareholders funds
Risky - Negative EBITDA
Total Returns (Price + Dividend) 
SBEC Sugar for the last several years.
Risk Adjusted Returns v/s
Returns Beta

News
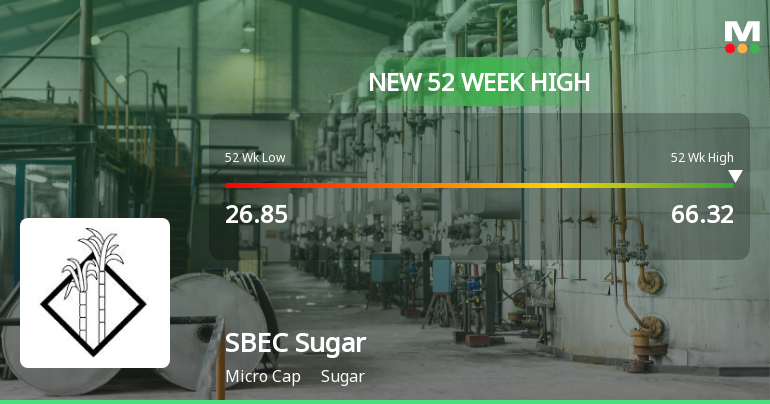
Broad-Based Technical Strength Lifts SBEC Sugar Ltd to 52-Week High of Rs 66.32
With a decisive surge to Rs 66.32 on 11 Jun 2026, SBEC Sugar Ltd has reached a fresh 52-week high, propelled by a remarkable 128.3% rally over the past ten trading days. This momentum stands out amid a broader market environment where the Sensex is retreating, underscoring the stock’s technical resilience.
Read full news article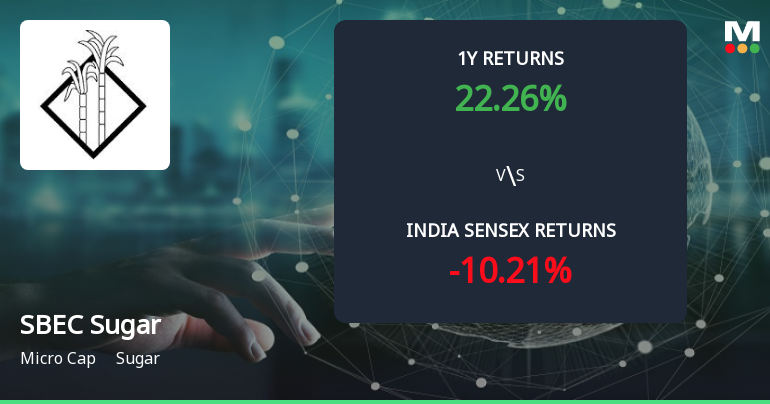
Golden Cross Forms in SBEC Sugar Ltd Amid Mixed Technical Signals and Strong Recent Rally
The 50-day moving average has crossed above the 200-day moving average for SBEC Sugar Ltd, signalling a golden cross on 10 Jun 2026. Yet, the broader technical picture is nuanced, with some indicators supporting the crossover while others suggest caution. This divergence invites a closer look at whether the golden cross is a reliable signal or a lagging confirmation of recent price action.
Read full news article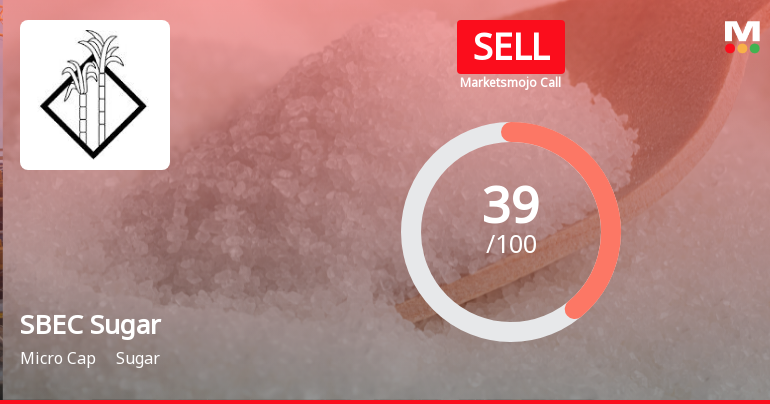
SBEC Sugar Ltd Upgraded to Sell on Improving Financial and Technical Trends
SBEC Sugar Ltd has seen its investment rating upgraded from Strong Sell to Sell following a marked improvement in its financial performance and technical indicators. Despite lingering concerns over debt levels and long-term fundamentals, the company’s recent quarterly results and positive market momentum have prompted a reassessment of its outlook.
Read full news article Announcements
Announcement under Regulation 30 (LODR)-Newspaper Publication
31-May-2026 | Source : BSENewspaper publication as per Regulation 47 of SEBI (LODR) Regulations 2015
Revised Outcome Of Board Meeting Held On May 29 2026
30-May-2026 | Source : BSEDue to technical glitches we are hereby submitting again the copy of Audited Standalone and Consolidated Financial Results for the year ending March 31 2026 along with all annexures
Financial Results
29-May-2026 | Source : BSEFinancial Results as on 31.03.2026
Corporate Actions

No Upcoming Board Meetings

No Dividend history available

No Splits history available

No Bonus history available

No Rights history available
Quality key factors
Valuation key factors
Technicals key factors
 Technical Indicator Scale: Bearish, Mildly Bearish, Sideways, Mildly Bullish, Bullish Turned
 Shareholding Snapshot : Mar 2026
Shareholding Compare (%holding)
Promoters
None
Held by 0 Schemes
Held by 0 FIIs
Sbec Systems India Limited (29.86%)
Abhikum Leasing And Investments Private Limited (11.81%)
15.15%
Quarterly Results Snapshot (Consolidated) - Mar'26 - QoQ

QoQ Growth in quarter ended Mar 2026 is 29.21% vs -16.19% in Dec 2025
QoQ Growth in quarter ended Mar 2026 is 623.64% vs 39.47% in Dec 2025
Half Yearly Results Snapshot (Consolidated) - Sep'25

Growth in half year ended Sep 2025 is -4.20% vs 2.60% in Sep 2024
Growth in half year ended Sep 2025 is -28.09% vs -1.55% in Sep 2024
Nine Monthly Results Snapshot (Consolidated) - Dec'25
YoY Growth in nine months ended Dec 2025 is -7.56% vs 1.46% in Dec 2024
YoY Growth in nine months ended Dec 2025 is -10.73% vs -47.00% in Dec 2024
Annual Results Snapshot (Consolidated) - Mar'26
YoY Growth in year ended Mar 2026 is -13.01% vs -3.67% in Mar 2025
YoY Growth in year ended Mar 2026 is -61.21% vs 497.52% in Mar 2025
About SBEC Sugar Ltd

Company Coordinates


