
Compare SBI Cards with Similar Stocks
Dashboard
Strong Long Term Fundamental Strength with an average Return on Equity (ROE) of 18.29%
- Healthy long term growth as Operating profit has grown by an annual rate of 20.38%
Positive results in Mar 26
With ROE of 13.8, it has a Fair valuation with a 3.6 Price to Book Value
High Institutional Holdings at 27.66%
Below par performance in long term as well as near term
Stock DNA
Non Banking Financial Company (NBFC)
INR 57,511 Cr (Mid Cap)
26.00
282
0.42%
2.80
13.78%
3.61
Total Returns (Price + Dividend) 
Latest dividend: 2.5 per share ex-dividend date: Mar-11-2026
Risk Adjusted Returns v/s
Returns Beta

News

SBI Cards & Payment Services Ltd is Rated Hold
SBI Cards & Payment Services Ltd is rated 'Hold' by MarketsMOJO, with this rating last updated on 27 Apr 2026. However, the analysis and financial metrics discussed here reflect the stock's current position as of 30 June 2026, providing investors with the latest insights into its performance and outlook.
Read full news article
SBI Cards & Payment Services Ltd Technical Momentum Shifts Amid Market Pressure
SBI Cards & Payment Services Ltd has experienced a notable shift in its technical momentum, moving from a bearish stance to a mildly bearish outlook. Despite this subtle improvement, the stock continues to face significant downward pressure, reflected in its recent price action and key technical indicators such as MACD, RSI, and moving averages.
Read full news article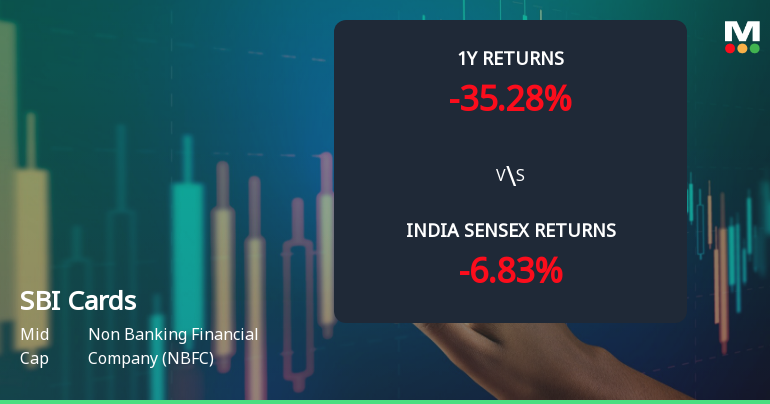
SBI Cards & Payment Services Ltd: Technical Momentum Shifts Amid Bearish Trends
SBI Cards & Payment Services Ltd, a mid-cap player in the Non Banking Financial Company (NBFC) sector, has experienced a notable shift in its technical momentum, reflecting a complex interplay of bullish and bearish signals across multiple timeframes. Despite a recent upgrade in its Mojo Grade from Sell to Hold, the stock’s price action and technical indicators suggest a cautious outlook for investors navigating the current market environment.
Read full news article Announcements
Corporate Actions

No Upcoming Board Meetings

SBI Cards & Payment Services Ltd has declared 25% dividend, ex-date: 11 Mar 26

No Splits history available

No Bonus history available

No Rights history available
Quality key factors
Valuation key factors
Technicals key factors
 Technical Indicator Scale: Bearish, Mildly Bearish, Sideways, Mildly Bullish, Bullish Turned
 Shareholding Snapshot : Mar 2026
Shareholding Compare (%holding)
Promoters
None
Held by 27 Schemes (10.65%)
Held by 488 FIIs (9.54%)
State Bank Of India (68.58%)
Life Insurance Corporation Of India - P & Gs Fund (6.11%)
2.88%
Quarterly Results Snapshot (Standalone) - Mar'26 - QoQ

QoQ Growth in quarter ended Mar 2026 is -3.76% vs 3.35% in Dec 2025
QoQ Growth in quarter ended Mar 2026 is 9.46% vs 25.15% in Dec 2025
Half Yearly Results Snapshot (Standalone) - Sep'25

Growth in half year ended Sep 2025 is 12.05% vs 9.76% in Sep 2024
Growth in half year ended Sep 2025 is 0.19% vs -16.51% in Sep 2024
Nine Monthly Results Snapshot (Standalone) - Dec'25
YoY Growth in nine months ended Dec 2025 is 11.69% vs 6.16% in Dec 2024
YoY Growth in nine months ended Dec 2025 is 12.68% vs -20.82% in Dec 2024
Annual Results Snapshot (Standalone) - Mar'26
YoY Growth in year ended Mar 2026 is 10.11% vs 6.51% in Mar 2025
YoY Growth in year ended Mar 2026 is 13.06% vs -20.41% in Mar 2025
About SBI Cards & Payment Services Ltd

Company Coordinates


