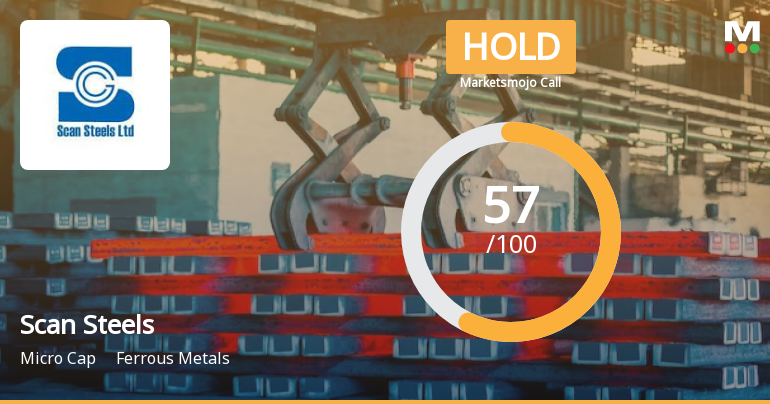
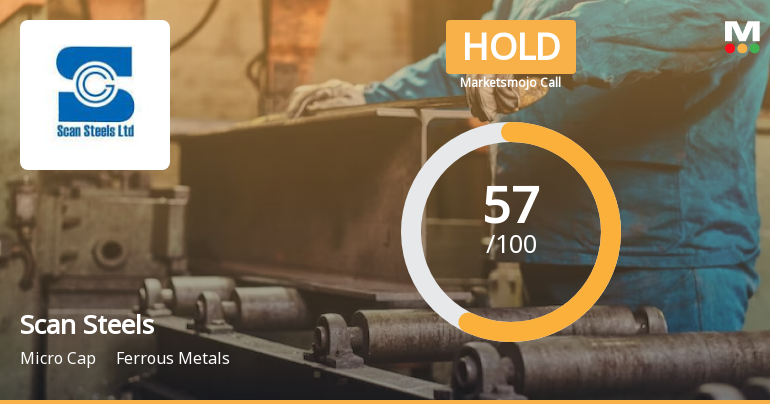
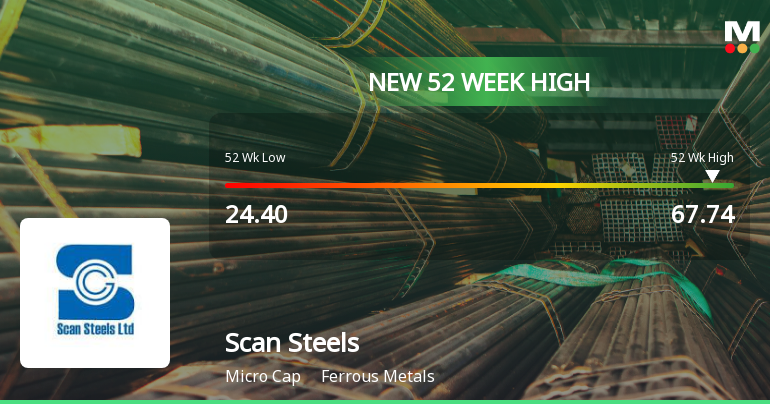
Scan Steels

  • Market Cap: Micro Cap
  • Industry: Ferrous Metals
  • ISIN: INE099G01011
  • NSEID: SCANSTL
  • BSEID: 511672
INR
59.00
0.98 (1.69%)
BSENSE

Sep 03, 11:19 AM

BSE+NSE Vol: 14.62 k

  • Price Points
  • Score
  • Mojo Parameters
  • Total Return
  • News and Corporate Actions
  • Key factors
  • Shareholding
  • Financials
  • CompanyCV
stock-summaryPrice Point
High/Low

1Day

52 Week

Valuation
Technical
Day's Volume

CASH

14.62 k (63.13%) Volume

Shareholding (Jun 2026)

FII

1.98%

Held by 1 FIIs

DII

0.00%

Held by 0 DIIs

Promoter

49.29%

Why is Scan Steels Ltd falling/rising?

03-Sep-2026

As of 02-Sep, Scan Steels Ltd's stock price is rising to Rs 59.80 after a trend reversal, gaining 2.26% despite an initial decline. The stock has shown strong year-to-date performance, increasing 64.83%, and has attracted more investor interest, indicating a bullish trend.

As of 02-Sep, Scan Steels Ltd's stock price is rising, currently at Rs 59.80, reflecting an increase of Rs 1.32 or 2.26%. This upward movement comes after a trend reversal, as the stock has gained after four consecutive days of decline. Despite opening the day with a loss of 3.81%, the stock managed to reach an intraday high of Rs 59.89, indicating a recovery during the trading session.<BR><BR>The stock has shown strong performance year-to-date, with a remarkable increase of 64.83%, significantly outperforming the Sensex, which has declined by 10.15% in the same period. Over the past year, Scan Steels Ltd has also outperformed the benchmark, rising by 71.69% compared to the Sensex's 4.48% decline. <BR><BR>Additionally, there has been a notable increase in investor participation, with delivery volume rising by 17.18% against the 5-day average, suggesting growing interest in the stock. The stock's current price is above the 50-day, 100-day, and 200-day moving averages, which typically indicates a bullish trend, although it is lower than the 5-day and 20-day moving averages. <BR><BR>Overall, the combination of a trend reversal, strong year-to-date performance, increased investor participation, and a recovery from an initial decline contributes to the rising stock price of Scan Steels Ltd.

View full answer

Who are in the management team of Scan Steels?

01-Sep-2026

The management team of Scan Steels includes Rajesh Gadodia (Chairman), Ankur Madaan (Whole-time Director), Praveen Kumar Patro (Executive Director), and three Independent Non-Executive Directors: Shravan Kumar Agrawal, Punit Kedia, and Debjani Sahu.

The management team of Scan Steels includes the following individuals:<BR><BR>1. **Rajesh Gadodia** - Chairman & Non-Executive Director<BR>2. **Ankur Madaan** - Whole-time Director<BR>3. **Praveen Kumar Patro** - Executive Director<BR>4. **Shravan Kumar Agrawal** - Independent Non-Executive Director<BR>5. **Punit Kedia** - Independent Non-Executive Director<BR>6. **Debjani Sahu** - Independent Non-Executive Director<BR><BR>If you need more details about any specific member or their roles, feel free to ask!

View full answer

What does Scan Steels do?

01-Sep-2026

Scan Steels Ltd operates in the ferrous metals industry, reporting net sales of 258 Cr and a net profit of 13 Cr for June 2026, with a market cap of INR 357 Cr. The company has a P/E ratio of 14.00 and a debt-equity ratio of 0.15.

Overview:<BR>Scan Steels Ltd operates in the ferrous metals industry and is categorized as a micro-cap company.<BR><BR>History:<BR>The company was incorporated in 1994 as Mittal Securities Private Limited and underwent several name changes, becoming a public limited company in 1994. The latest quarter reported for sales and profit is June 2026.<BR><BR>Financial Snapshot:<BR>Net Sales: 258 Cr (Quarterly Results - Jun 2026) <BR>Net Profit: 13 Cr (Quarterly Results - Jun 2026) <BR>Market Cap: INR 357 Cr (Micro Cap)<BR><BR>Key Metrics:<BR>P/E: 14.00 <BR>Industry P/E: 25 <BR>Dividend Yield: 0.00% <BR>Debt-Equity: 0.15 <BR>Return on Equity: 4.91% <BR>Price to Book: 0.82 <BR><BR>Contact Details:<BR>Address: 104-105 E Square Subhas Road, Vile Parle(E) Mumbai Maharashtra : 400057 <BR>Tel: 91-022-26185461/62 <BR>Email: secretarial@scansteels.com <BR>Website: http://www.scansteels.com

View full answer

Who are the peers of the Scan Steels?

01-Sep-2026

Scan Steels' peers include S.A.L Steel, Manaksia Steels, Neetu Yoshi, VISA Chrome, Vraj Iron, Nagpur Power, Vaswani Industri, KIC Metaliks, Indsil Hydro, and Jainam Ferro. In terms of performance, S.A.L Steel leads with a 1-year return of 338.02%, while Scan Steels has a return of 67.89%.

Peers: The peers of Scan Steels are S.A.L Steel, Manaksia Steels, Neetu Yoshi, VISA Chrome, Vraj Iron, Nagpur Power, Vaswani Industri, KIC Metaliks, Indsil Hydro, and Jainam Ferro.<BR><BR>Quality Snapshot: Excellent management risk is observed at Neetu Yoshi and Indsil Hydro, while Average management risk is found at Manaksia Steels, Scan Steels, and Vaswani Industri. Below Average management risk is present at S.A.L Steel, Vraj Iron, Nagpur Power, KIC Metaliks, and Jainam Ferro, and the rest. Growth ratings show Excellent growth at Neetu Yoshi, Average growth at Manaksia Steels, Scan Steels, and Indsil Hydro, and Below Average growth at S.A.L Steel, Vraj Iron, Nagpur Power, Vaswani Industri, KIC Metaliks, and Jainam Ferro, and the rest. Good capital structure is noted at Manaksia Steels, Scan Steels, Nagpur Power, and Neetu Yoshi, while Below Average capital structure is seen at S.A.L Steel, VISA Chrome, Vraj Iron, Vaswani Industri, KIC Metaliks, and Indsil Hydro, and the rest.<BR><BR>Return Snapshot: The peer with the highest 1-year return is S.A.L Steel at 338.02%, while the lowest is Vraj Iron at -14.04%. Scan Steels has a 1-year return of 67.89%, which is significantly lower than S.A.L Steel's but higher than Vraj Iron's. Additionally, the peers Vaswani Industri, Indsil Hydro, and Jainam Ferro have negative six-month returns.

View full answer

How big is Scan Steels?

01-Sep-2026

As of 31st August, Scan Steels Ltd has a market capitalization of 357.00 Cr, with net sales of 864.05 Cr and a net profit of 24.77 Cr for the latest four quarters. The company reported shareholder's funds of 422.96 Cr and total assets of 579.22 Cr as of March 2025.

As of 31st August, Scan Steels Ltd has a market capitalization of 357.00 Cr, which categorizes it as a Micro Cap company.<BR><BR>For the latest four quarters, Scan Steels reported Net Sales of 864.05 Cr and a Net Profit of 24.77 Cr.<BR><BR>As of the latest annual period in March 2025, the company had Shareholder's Funds amounting to 422.96 Cr and Total Assets of 579.22 Cr.

View full answer

Should I buy, sell or hold Scan Steels Ltd?

30-Jul-2026

Are Scan Steels Ltd latest results good or bad?

29-Jul-2026

Scan Steels Ltd's latest Q1 FY27 results show a significant net profit increase of 68.79% to ₹13.25 crores and the highest operating margin in seven quarters at 9.08%. However, revenue declined by 8.47% from the previous quarter, raising concerns about sustainability, and the low return on equity of 5.01% indicates ongoing challenges.

Scan Steels Ltd's latest results for Q1 FY27 present a mixed picture. On the positive side, the company achieved a net profit of ₹13.25 crores, which is a significant increase of 68.79% compared to the previous quarter. This indicates improved profitability and operational efficiency. Additionally, the operating margin reached 9.08%, the highest in seven quarters, reflecting better cost management and a favorable product mix.<BR><BR>However, the revenue for the quarter was ₹257.79 crores, which represents an 8.47% decline from the previous quarter. This decrease in revenue is concerning, although it does show an 11.12% year-on-year growth compared to the same quarter last year.<BR><BR>While the profit growth is commendable, the decline in revenue raises questions about the sustainability of this performance. Furthermore, the company's return on equity (ROE) remains low at 5.01%, which is below industry averages, indicating challenges in capital efficiency.<BR><BR>In summary, while Scan Steels has made notable strides in profitability and margin improvement, the revenue decline and low return metrics suggest that there are still significant challenges to address. Overall, the results can be seen as a positive step, but caution is warranted given the mixed indicators.

View full answer

When is the next results date for Scan Steels Ltd?

05-May-2026

The next results date for Scan Steels Ltd is 15 May 2026.

The next results date for Scan Steels Ltd is scheduled for 15 May 2026.

View full answer

Is Scan Steels overvalued or undervalued?

20-Nov-2025

As of November 19, 2025, Scan Steels is considered attractively undervalued with a PE ratio of 11.27 and a Price to Book Value of 0.48, indicating a significant discount compared to peers like JSW Steel and Tata Steel, despite a year-to-date return of -23.53% against the Sensex.

As of 19 November 2025, Scan Steels has moved from a very attractive to an attractive valuation grade. The company appears to be undervalued, with a PE ratio of 11.27, a Price to Book Value of 0.48, and an EV to EBITDA of 7.00. These ratios suggest that the stock is trading at a significant discount compared to its peers, particularly when considering JSW Steel, which has a PE ratio of 46.65, and Tata Steel, with a PE ratio of 29.03.<BR><BR>In comparison to its peers, Scan Steels' valuation metrics indicate a strong relative position, especially with an EV to Sales ratio of 0.39, which is considerably lower than many competitors. The company has also shown a return on capital employed (ROCE) of 5.29% and a return on equity (ROE) of 4.29%, which, while modest, reflect potential for improvement. Despite recent underperformance against the Sensex, with a year-to-date return of -23.53% compared to the Sensex's 9.02%, the current valuation suggests that Scan Steels may present a buying opportunity.

View full answer

How has been the historical performance of Scan Steels?

19-Nov-2025

Scan Steels has seen a decline in net sales from 1,090.78 Cr in Mar'23 to 789.20 Cr in Mar'25, but profitability improved with profit before tax rising to 26.08 Cr and profit after tax to 19.60 Cr. However, cash flow from operations significantly decreased, resulting in a net cash outflow in Mar'25, raising liquidity concerns.

Answer:<BR>The historical performance of Scan Steels shows a declining trend in net sales over the past three years, with figures of 1,090.78 Cr in Mar'23, 965.41 Cr in Mar'24, and further decreasing to 789.20 Cr in Mar'25. Despite this decline in sales, the company has managed to improve its profit before tax, which rose from 22.00 Cr in Mar'23 to 24.16 Cr in Mar'24, and then to 26.08 Cr in Mar'25. Profit after tax also increased from 15.32 Cr in Mar'23 to 19.60 Cr in Mar'25, indicating a positive trend in profitability. The operating profit margin (excluding other income) improved from 4.46% in Mar'23 to 5.75% in Mar'25, reflecting better cost management. However, total liabilities decreased from 608.30 Cr in Mar'24 to 579.22 Cr in Mar'25, while total assets also saw a slight decline from 608.30 Cr to 579.22 Cr in the same period. The company's cash flow from operating activities has decreased significantly from 81.00 Cr in Mar'24 to 6.00 Cr in Mar'25, contributing to a net cash outflow of 22.00 Cr in Mar'25.<BR><BR>Breakdown:<BR>Scan Steels has experienced a notable decline in net sales, dropping from 1,090.78 Cr in Mar'23 to 789.20 Cr in Mar'25. Despite this, the company has shown resilience in profitability, with profit before tax increasing from 22.00 Cr in Mar'23 to 26.08 Cr in Mar'25, and profit after tax rising from 15.32 Cr to 19.60 Cr in the same period. The operating profit margin has improved, indicating enhanced efficiency in managing expenses. On the balance sheet, total liabilities decreased, while total assets also saw a slight decline, suggesting a tightening of financial resources. The cash flow from operating activities has significantly reduced, leading to a net cash outflow in Mar'25, which may raise concerns about liquidity moving forward.

View full answer

Who are the top shareholders of the Scan Steels?

17-Jul-2025

The top shareholders of Scan Steels are Artline Commerce Private Limited with 16.33%, Gopikar Supply Pvt Ltd at 5.85%, and individual investors holding 16.84%. There is also one foreign institutional investor with 2.05%, and there are no pledged promoter holdings or mutual fund investments.

The top shareholders of Scan Steels include Artline Commerce Private Limited, which holds the highest promoter stake at 16.33%. Additionally, Gopikar Supply Pvt Ltd is the highest public shareholder with a holding of 5.85%. Individual investors collectively own 16.84% of the company. There is also one foreign institutional investor (FII) that holds 2.05% of the shares. Notably, there are no pledged promoter holdings and no mutual funds currently invested in the company.

View full answer

What is the technical trend for Scan Steels?

09-Jun-2025

As of May 12, 2025, Scan Steels shows a mildly bearish trend with mixed signals from MACD and moving averages, while Bollinger Bands remain bearish.

As of 12 May 2025, the technical trend for Scan Steels has changed from bearish to mildly bearish. The weekly MACD indicates a mildly bullish stance, while the monthly MACD remains bearish. The daily moving averages are mildly bearish, and both the weekly and monthly Bollinger Bands are bearish. The KST shows a mildly bullish signal on the weekly timeframe but is bearish monthly. Dow Theory indicates no trend in both weekly and monthly timeframes. Overall, the current technical stance is mildly bearish, driven primarily by the mixed signals from MACD and moving averages, alongside bearish Bollinger Bands.

View full answer

Has Scan Steels declared dividend?

06-Jun-2025

No Dividend History Available

iScoreScore
Click here to find our call on this stock
Strong Sell
Sell
Hold
Buy
Strong Buy

Dashboard

1

Weak Long Term Fundamental Strength with a -7.84% CAGR growth in Operating Profits over the last 5 years

  • The company has been able to generate a Return on Equity (avg) of 5.01% signifying low profitability per unit of shareholders funds
2

Positive results in Jun 26

3

With ROCE of 6.5, it has a Attractive valuation with a 0.8 Enterprise value to Capital Employed

4

Majority shareholders : Promoters

 
stock-summaryMojo Parameters

Mojo Parameters

Loading Valuation Snapshot...

Stock DNA

stock-summary
Industry

Ferrous Metals

stock-summary
Market cap

INR 361 Cr (Micro Cap)

stock-summary
P/E

15.00

stock-summary
Industry P/E

25

stock-summary
Dividend Yield

0.00%

stock-summary
Debt Equity

0.15

stock-summary
Return on Equity

4.91%

stock-summary
Price to Book

0.81

Revenue and Profits:
Net Sales:
258 Cr
(Quarterly Results - Jun 2026)
Net Profit:
13 Cr
stock-summaryTotal Returns
Total Returns (Price + Dividend) stock-summary
Dividend Yield (0%)
TimePeriod
Price Return
Dividend Return
Total Return
3 Months
58.69%
0%
58.69%
6 Months
0%
0%
0.0%
1 Year
0%
0%
0.0%
2 Years
0%
0%
0.0%
3 Years
0%
0%
0.0%
4 Years
0%
0%
0.0%
5 Years
0%
0%
0.0%

Scan Steels for the last several years.

Risk Adjusted Returns v/s stock-summary
Returns Beta
Icon
Beta has not been calculated since enough price history is not available
stock-summaryKey Factors

Quality key factors stock-summary

Factor
Value
Sales Growth (5y)
-5.71%
EBIT Growth (5y)
-7.84%
EBIT to Interest (avg)
4.01
Debt to EBITDA (avg)
1.91
Net Debt to Equity (avg)
0.15
Sales to Capital Employed (avg)
1.64
Tax Ratio
25.29%
Dividend Payout Ratio
0
Pledged Shares
0
Institutional Holding
1.98%
ROCE (avg)
6.42%
ROE (avg)
5.01%

Valuation key factors

Factor
Value
P/E Ratio
15
Industry P/E
25
Price to Book Value
0.81
EV to EBIT
11.48
EV to EBITDA
8.09
EV to Capital Employed
0.83
EV to Sales
0.50
PEG Ratio
0.41
Dividend Yield
NA
ROCE (Latest)
6.47%
ROE (Latest)
4.91%

Technicals key factors

Indicator
Weekly
Monthly
MACD
Bullish
Bullish
RSI
Bearish
No Signal
Bollinger Bands
Mildly Bullish
Bullish
Moving Averages
Bullish (Daily)
KST
Bullish
Bullish
Dow Theory
Mildly Bearish
Mildly Bullish
OBV
Bullish
No Trend
stock-summary Technical Indicator Scale: Bearish, Mildly Bearish, Sideways, Mildly Bullish, Bullish  Turned 
stock-summaryShareholding
Shareholding Snapshot : Jun 2026stock-summary
Shareholding Compare (%holding) stock-summary
Majority shareholders

Promoters

Pledged Promoter Holdings

None

Mutual Funds

Held by 0 Schemes

FIIs

Held by 1 FIIs (1.98%)

Promoter with highest holding

Bayanwala Brothers Pvt Limited (16.36%)

Highest Public shareholder

Gopikar Supply Pvt Ltd (6.46%)

Individual Investors Holdings

17.36%

stock-summaryFinancial
[
  {
    "link": "quarterly",
    "btn_text": "All Quarterly Results",
    "header": "Quarterly Results Snapshot (Consolidated) - Jun'26 - QoQ",
    "rhs": [
      {
        "prefix": "Net Sales ",
        "suffix": "QoQ Growth in quarter ended Jun 2026 is -8.47% vs 46.97% in Mar 2026",
        "dir": -1
      },
      {
        "prefix": "Consolidated Net Profit ",
        "suffix": "QoQ Growth in quarter ended Jun 2026 is 68.79% vs 125.57% in Mar 2026",
        "dir": -1
      }
    ],
    "table": {
      "header": [
        "Jun'26",
        "Mar'26",
        "Change(%)"
      ],
      "body": [
        {
          "field": "Net Sales",
          "val1": "257.79",
          "val2": "281.66",
          "chgp": "-8.47%",
          "chgp_class": "negative"
        },
        {
          "field": "Operating Profit (PBDIT) excl Other Income",
          "val1": "23.42",
          "val2": "13.68",
          "chgp": "71.20%",
          "chgp_class": "positive"
        },
        {
          "field": "Interest",
          "val1": "2.45",
          "val2": "1.96",
          "chgp": "25.00%",
          "chgp_class": "negative"
        },
        {
          "field": "Exceptional Items",
          "val1": "0.00",
          "val2": "0.00",
          "chgp": "",
          "chgp_class": "neutral"
        },
        {
          "field": "Consolidate Net Profit",
          "val1": "13.25",
          "val2": "7.85",
          "chgp": "68.79%",
          "chgp_class": "positive"
        },
        {
          "field": "Operating Profit Margin (Excl OI)",
          "val1": "9.08%",
          "val2": "4.86%",
          "chgp": "4.22%",
          "chgp_class": "positive"
        }
      ]
    }
  },
  {
    "link": "half-yearly",
    "btn_text": "All Half Yearly Results",
    "header": "Half Yearly Results Snapshot (Consolidated) - Sep'25",
    "rhs": [
      {
        "prefix": "Net Sales ",
        "suffix": " Growth in half year ended Sep 2025 is -2.29% vs -23.61% in Sep 2024",
        "dir": 1
      },
      {
        "prefix": "Consolidated Net Profit ",
        "suffix": " Growth in half year ended Sep 2025 is -22.25% vs 70.81% in Sep 2024",
        "dir": -1
      }
    ],
    "table": {
      "header": [
        "Sep'25",
        "Sep'24",
        "Change(%)"
      ],
      "body": [
        {
          "field": "Net Sales",
          "val1": "364.96",
          "val2": "373.50",
          "chgp": "-2.29%",
          "chgp_class": "negative"
        },
        {
          "field": "Operating Profit (PBDIT) excl Other Income",
          "val1": "25.00",
          "val2": "26.55",
          "chgp": "-5.84%",
          "chgp_class": "negative"
        },
        {
          "field": "Interest",
          "val1": "4.18",
          "val2": "4.15",
          "chgp": "0.72%",
          "chgp_class": "negative"
        },
        {
          "field": "Exceptional Items",
          "val1": "0.00",
          "val2": "0.00",
          "chgp": "",
          "chgp_class": "neutral"
        },
        {
          "field": "Consolidate Net Profit",
          "val1": "10.69",
          "val2": "13.75",
          "chgp": "-22.25%",
          "chgp_class": "negative"
        },
        {
          "field": "Operating Profit Margin (Excl OI)",
          "val1": "6.85%",
          "val2": "7.11%",
          "chgp": "-0.26%",
          "chgp_class": "negative"
        }
      ]
    }
  },
  {
    "link": "nine-monthly",
    "btn_text": "All Nine Monthly Results",
    "header": "Nine Monthly Results Snapshot (Consolidated) - Dec'25",
    "rhs": [
      {
        "prefix": "Net Sales ",
        "suffix": "YoY Growth in nine months ended Dec 2025 is 1.57% vs -22.64% in Dec 2024",
        "dir": 1
      },
      {
        "prefix": "Consolidated Net Profit ",
        "suffix": "YoY Growth in nine months ended Dec 2025 is -16.20% vs 75.78% in Dec 2024",
        "dir": -1
      }
    ],
    "table": {
      "header": [
        "Dec'25",
        "Dec'24",
        "Change(%)"
      ],
      "body": [
        {
          "field": "Net Sales",
          "val1": "556.60",
          "val2": "548.01",
          "chgp": "1.57%",
          "chgp_class": "positive"
        },
        {
          "field": "Operating Profit (PBDIT) excl Other Income",
          "val1": "35.42",
          "val2": "36.43",
          "chgp": "-2.77%",
          "chgp_class": "negative"
        },
        {
          "field": "Interest",
          "val1": "6.51",
          "val2": "6.23",
          "chgp": "4.49%",
          "chgp_class": "negative"
        },
        {
          "field": "Exceptional Items",
          "val1": "0.00",
          "val2": "0.00",
          "chgp": "",
          "chgp_class": "neutral"
        },
        {
          "field": "Consolidate Net Profit",
          "val1": "14.17",
          "val2": "16.91",
          "chgp": "-16.20%",
          "chgp_class": "negative"
        },
        {
          "field": "Operating Profit Margin (Excl OI)",
          "val1": "6.36%",
          "val2": "6.65%",
          "chgp": "-0.29%",
          "chgp_class": "negative"
        }
      ]
    }
  },
  {
    "link": "annual",
    "btn_text": "All Annual Results",
    "header": "Annual Results Snapshot (Consolidated) - Mar'26",
    "rhs": [
      {
        "prefix": "Net Sales ",
        "suffix": "YoY Growth in year ended Mar 2026 is 6.22% vs -18.25% in Mar 2025",
        "dir": 1
      },
      {
        "prefix": "Consolidated Net Profit ",
        "suffix": "YoY Growth in year ended Mar 2026 is 1.66% vs 2.85% in Mar 2025",
        "dir": -1
      }
    ],
    "table": {
      "header": [
        "Mar'26",
        "Mar'25",
        "Change(%)"
      ],
      "body": [
        {
          "field": "Net Sales",
          "val1": "838.26",
          "val2": "789.20",
          "chgp": "6.22%",
          "chgp_class": "positive"
        },
        {
          "field": "Operating Profit (PBDIT) excl Other Income",
          "val1": "49.10",
          "val2": "45.36",
          "chgp": "8.25%",
          "chgp_class": "positive"
        },
        {
          "field": "Interest",
          "val1": "8.47",
          "val2": "8.19",
          "chgp": "3.42%",
          "chgp_class": "negative"
        },
        {
          "field": "Exceptional Items",
          "val1": "0.00",
          "val2": "0.00",
          "chgp": "",
          "chgp_class": "neutral"
        },
        {
          "field": "Consolidate Net Profit",
          "val1": "22.01",
          "val2": "21.65",
          "chgp": "1.66%",
          "chgp_class": "positive"
        },
        {
          "field": "Operating Profit Margin (Excl OI)",
          "val1": "5.86%",
          "val2": "5.75%",
          "chgp": "0.11%",
          "chgp_class": "positive"
        }
      ]
    }
  }
]

Quarterly Results Snapshot (Consolidated) - Jun'26 - QoQstock-summary

Jun'26
Mar'26
Change(%)
Net Sales
257.79
281.66
-8.47%
Operating Profit (PBDIT) excl Other Income
23.42
13.68
71.20%
Interest
2.45
1.96
25.00%
Exceptional Items
0.00
0.00
Consolidate Net Profit
13.25
7.85
68.79%
Operating Profit Margin (Excl OI)
9.08%
4.86%
4.22%
Values in Rs Cr.
Direction Arrows
Net Sales

QoQ Growth in quarter ended Jun 2026 is -8.47% vs 46.97% in Mar 2026

Direction Arrows
Consolidated Net Profit

QoQ Growth in quarter ended Jun 2026 is 68.79% vs 125.57% in Mar 2026

Half Yearly Results Snapshot (Consolidated) - Sep'25stock-summary

Sep'25
Sep'24
Change(%)
Net Sales
364.96
373.50
-2.29%
Operating Profit (PBDIT) excl Other Income
25.00
26.55
-5.84%
Interest
4.18
4.15
0.72%
Exceptional Items
0.00
0.00
Consolidate Net Profit
10.69
13.75
-22.25%
Operating Profit Margin (Excl OI)
6.85%
7.11%
-0.26%
Values in Rs Cr.
Direction Arrows
Net Sales

Growth in half year ended Sep 2025 is -2.29% vs -23.61% in Sep 2024

Direction Arrows
Consolidated Net Profit

Growth in half year ended Sep 2025 is -22.25% vs 70.81% in Sep 2024

Nine Monthly Results Snapshot (Consolidated) - Dec'25stock-summary

Dec'25
Dec'24
Change(%)
Net Sales
556.60
548.01
1.57%
Operating Profit (PBDIT) excl Other Income
35.42
36.43
-2.77%
Interest
6.51
6.23
4.49%
Exceptional Items
0.00
0.00
Consolidate Net Profit
14.17
16.91
-16.20%
Operating Profit Margin (Excl OI)
6.36%
6.65%
-0.29%
Values in Rs Cr.
Direction Arrows
Net Sales

YoY Growth in nine months ended Dec 2025 is 1.57% vs -22.64% in Dec 2024

Direction Arrows
Consolidated Net Profit

YoY Growth in nine months ended Dec 2025 is -16.20% vs 75.78% in Dec 2024

Annual Results Snapshot (Consolidated) - Mar'26stock-summary

Mar'26
Mar'25
Change(%)
Net Sales
838.26
789.20
6.22%
Operating Profit (PBDIT) excl Other Income
49.10
45.36
8.25%
Interest
8.47
8.19
3.42%
Exceptional Items
0.00
0.00
Consolidate Net Profit
22.01
21.65
1.66%
Operating Profit Margin (Excl OI)
5.86%
5.75%
0.11%
Values in Rs Cr.
Direction Arrows
Net Sales

YoY Growth in year ended Mar 2026 is 6.22% vs -18.25% in Mar 2025

Direction Arrows
Consolidated Net Profit

YoY Growth in year ended Mar 2026 is 1.66% vs 2.85% in Mar 2025

stock-summaryCompany CV
About Scan Steels Ltd stock-summary
stock-summary
Scan Steels Ltd
Micro Cap
Ferrous Metals
Scan Steels Limited was formerly incorporated as Mittal Securities Private Limited on January 18, 1994 as a Private Limited Company. The Company converted in the Public Limited Company on 18 October 1994 and the name was changed to Mittal Securities Finance Limited. On November 7, 2007, it changed to Clarus Finance & Securities Limited and to Clarus Infrastructure Realties Limited on March 31, 2010 and once again attained the name to 'Scan Steels Limited' with effect from 26 September, 2014.
Company Coordinates stock-summary
Company Details
104-105 E Square Subhas Road, Vile Parle(E) Mumbai Maharashtra : 400057
stock-summary
Tel: 91-022-26185461/62
stock-summary
secretarial@scansteels.com
Registrar Details
Adroit Corporate Services Pvt Ltd, 17-20 Jaferbhoy Industrial Estate , 1st Floor, Makwana Road, Marol Naka, Mumbai