
Compare Scoobee Garments with Similar Stocks
Dashboard
With a Operating Losses, the company has a Weak Long Term Fundamental Strength
- Poor long term growth as Operating profit has grown by an annual rate -234.79% of over the last 5 years
- High Debt Company with a Debt to Equity ratio (avg) of 9.37 times
- The company has been able to generate a Return on Capital Employed (avg) of 8.48% signifying low profitability per unit of total capital (equity and debt)
With a fall in Net Sales of -7.32%, the company declared Very Negative results in Mar 26
Risky - Negative EBITDA
Below par performance in long term as well as near term
Stock DNA
Garments & Apparels
INR 118 Cr (Micro Cap)
NA (Loss Making)
17
0.00%
0.24
-5.85%
1.26
Total Returns (Price + Dividend) 
Scoobee Garments for the last several years.
Risk Adjusted Returns v/s
Returns Beta

News
Scoobee Day Garments India Ltd is Rated Strong Sell
Scoobee Day Garments India Ltd is rated Strong Sell by MarketsMOJO. This rating was last updated on 02 September 2025. However, the analysis and financial metrics discussed here reflect the company’s current position as of 01 June 2026, providing investors with the latest insights into the stock’s fundamentals, valuation, financial trend, and technical outlook.
Read full news articleAre Scoobee Day Garments India Ltd latest results good or bad?
Scoobee Day Garments India Ltd's latest financial results for Q4 FY26 reflect a significant decline in operational performance compared to the previous year. The company reported a net profit of -₹1.52 crores, marking a stark contrast to a profit of ₹1.49 crores in the same quarter last year. Revenue also saw a substantial decline, dropping to ₹5.95 crores from ₹21.70 crores year-on-year, indicating a 72.58% reduction in sales. This revenue contraction has persisted over recent quarters, with negative year-on-year growth for three consecutive periods. The operating margin turned negative at -20.50%, a drastic shift from a positive margin of 15.62% in Q4 FY25, highlighting severe operational challenges. Similarly, the profit after tax margin fell to -25.55%, down from 6.87% year-on-year. The company's operational efficiency appears compromised, as employee costs have risen significantly, constituting a high...
Read full news article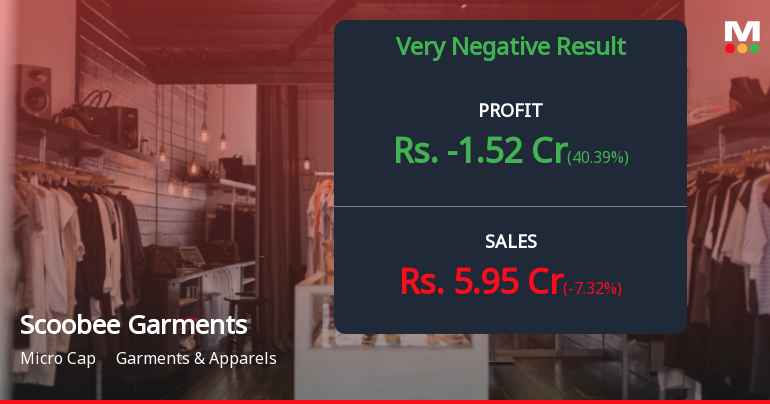
Scoobee Day Garments Q4 FY26: Steep Losses Deepen Amid Revenue Collapse
Scoobee Day Garments India Ltd., a micro-cap garments manufacturer with a market capitalisation of ₹125.00 crores, reported a dismal fourth quarter for FY26, posting a net loss of ₹1.52 crores compared to a profit of ₹1.49 crores in the same quarter last year. The 202.01% year-on-year collapse in profitability comes on the back of a severe 72.58% revenue contraction, signalling deep operational distress in the company's core business. Despite the concerning results, the stock rallied 5.00% to ₹73.50 following the announcement, though it remains down 25.83% over the past year.
Read full news article Announcements
Announcement under Regulation 30 (LODR)-Newspaper Publication
30-May-2026 | Source : BSENewspaper Publication
Announcement under Regulation 30 (LODR)-Change in Management
29-May-2026 | Source : BSERe-appointment of Internal Auditor
Results-Audited Standalone Financial 31.03.2026
29-May-2026 | Source : BSEResults- Audited Standalone Financial Statements
Corporate Actions

No Upcoming Board Meetings

No Dividend history available

No Splits history available

No Bonus history available

Scoobee Day Garments India Ltd has announced 1:3 rights issue, ex-date: 02 Sep 25
Quality key factors
Valuation key factors
Technicals key factors
 Technical Indicator Scale: Bearish, Mildly Bearish, Sideways, Mildly Bullish, Bullish Turned
 Shareholding Snapshot : Mar 2026
Shareholding Compare (%holding)
Promoters
None
Held by 0 Schemes
Held by 0 FIIs
Anna Aluminium Company (p)ltd (44.26%)
Thampi C C (1.48%)
15.05%
Quarterly Results Snapshot (Standalone) - Mar'26 - QoQ

QoQ Growth in quarter ended Mar 2026 is -7.32% vs 32.64% in Dec 2025

QoQ Growth in quarter ended Mar 2026 is 40.39% vs -10.39% in Dec 2025
Half Yearly Results Snapshot (Standalone) - Sep'25
Growth in half year ended Sep 2025 is 46.94% vs -33.95% in Sep 2024
Growth in half year ended Sep 2025 is -500.00% vs -88.42% in Sep 2024
Nine Monthly Results Snapshot (Standalone) - Dec'25
YoY Growth in nine months ended Dec 2025 is 8.02% vs -24.06% in Dec 2024
YoY Growth in nine months ended Dec 2025 is -1,050.00% vs -90.65% in Dec 2024
Annual Results Snapshot (Standalone) - Mar'26
YoY Growth in year ended Mar 2026 is -29.57% vs 15.64% in Mar 2025
YoY Growth in year ended Mar 2026 is -388.48% vs -48.93% in Mar 2025
About Scoobee Day Garments India Ltd

Company Coordinates


