
Compare Sejal Glass with Similar Stocks
Stock DNA
Industrial Products
INR 753 Cr (Micro Cap)
26.00
23
0.00%
1.24
18.99%
4.90
Total Returns (Price + Dividend) 
Latest dividend: 0.6 per share ex-dividend date: Sep-16-2008
Risk Adjusted Returns v/s
Returns Beta

News
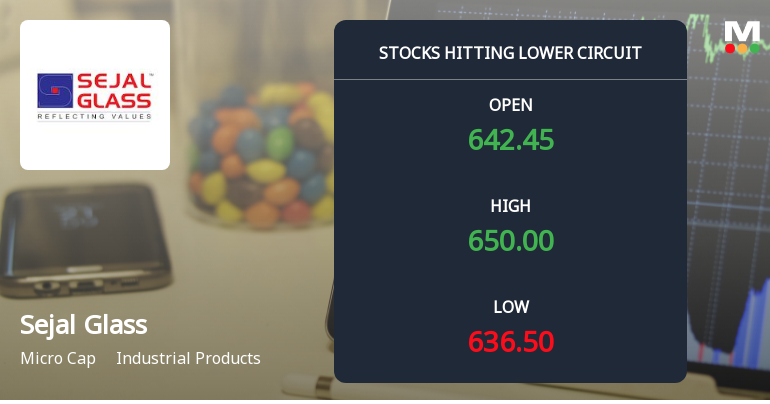
Sejal Glass Ltd Locks at Lower Circuit With 4.63% Loss — Sellers Queue, No Buyers in Sight
At Rs 642.7, sellers were still queuing — but there were no buyers willing to take the other side. Sejal Glass Ltd locked at its lower circuit of 5% on 10 Jun 2026, with unfilled sell orders and a frozen price, signalling persistent selling pressure in a micro-cap stock with limited liquidity.
Read full news article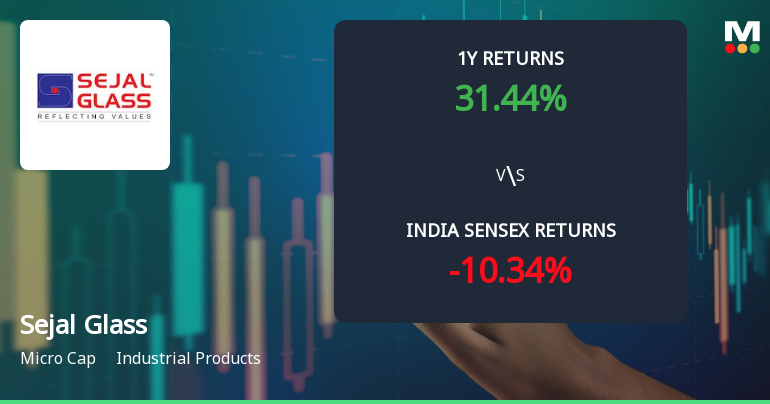
Sejal Glass Ltd Faces Technical Momentum Shift Amid Mixed Indicator Signals
Sejal Glass Ltd, a micro-cap player in the Industrial Products sector, has experienced a notable shift in its technical momentum, moving from a mildly bullish to a mildly bearish trend. Despite a recent downgrade from a Sell to a Hold rating by MarketsMOJO on 8 June 2026, the stock’s mixed technical indicators suggest a complex outlook for investors navigating its price movements and momentum signals.
Read full news article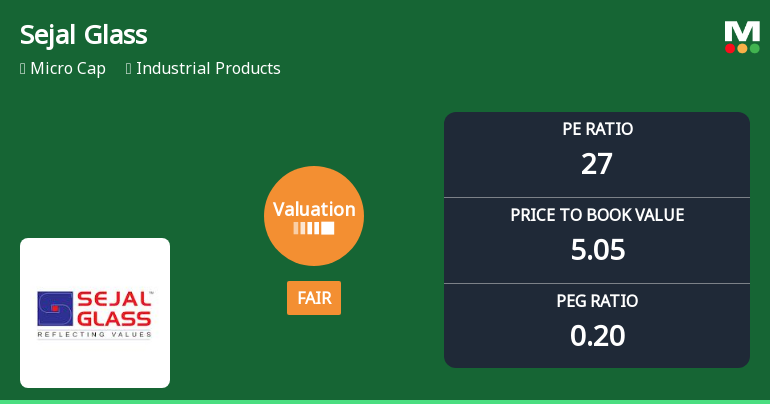
Sejal Glass Ltd Valuation Shifts Signal Improved Price Attractiveness Amid Mixed Market Returns
Sejal Glass Ltd, a micro-cap player in the Industrial Products sector, has witnessed a notable shift in its valuation parameters, moving from an expensive to a fair valuation grade. This change comes amid a backdrop of volatile stock performance and mixed returns relative to the broader Sensex index, prompting investors to reassess the company’s price attractiveness and growth prospects.
Read full news article Announcements
Intimation Of TV Interview
09-Jun-2026 | Source : BSEIntimation of TV Interview of Mr. Amrut S Gada Founder and Promoter of the Company with NDTV Profit
Announcement under Regulation 30 (LODR)-Analyst / Investor Meet - Intimation
25-May-2026 | Source : BSEIntimation of Schedule of Investor Meeting.
Announcement under Regulation 30 (LODR)-Earnings Call Transcript
19-May-2026 | Source : BSESejal Glass Limited has informed the Exchange about Transcript of Earnings Conference call for quarter and year ended 31st March 2026
Corporate Actions

No Upcoming Board Meetings

Sejal Glass Ltd has declared 6% dividend, ex-date: 16 Sep 08

Sejal Glass Ltd has announced 10:1 stock split, ex-date: 09 Nov 11

No Bonus history available

No Rights history available
Quality key factors
Valuation key factors
Technicals key factors
 Technical Indicator Scale: Bearish, Mildly Bearish, Sideways, Mildly Bullish, Bullish Turned
 Shareholding Snapshot : Mar 2026
Shareholding Compare (%holding)
Promoters
0.1492
Held by 0 Schemes
Held by 3 FIIs (0.19%)
Trushti Enterprises Llp (28.51%)
Abakkus Growth Fund-2 (4.39%)
14.86%
Quarterly Results Snapshot (Consolidated) - Mar'26 - YoY

YoY Growth in quarter ended Mar 2026 is 69.48% vs 35.34% in Mar 2025

YoY Growth in quarter ended Mar 2026 is 198.94% vs 1,084.38% in Mar 2025
Half Yearly Results Snapshot (Consolidated) - Sep'25
Growth in half year ended Sep 2025 is 58.45% vs 71.09% in Sep 2024
Growth in half year ended Sep 2025 is 223.76% vs 93.43% in Sep 2024
Nine Monthly Results Snapshot (Consolidated) - Dec'25
YoY Growth in nine months ended Dec 2025 is 60.26% vs 54.28% in Dec 2024
YoY Growth in nine months ended Dec 2025 is 141.81% vs 140.80% in Dec 2024
Annual Results Snapshot (Consolidated) - Mar'26
YoY Growth in year ended Mar 2026 is 62.78% vs 48.71% in Mar 2025
YoY Growth in year ended Mar 2026 is 162.23% vs 231.12% in Mar 2025
About Sejal Glass Ltd

Company Coordinates


