
Compare Sellowrap Indus. with Similar Stocks
Stock DNA
Other Industrial Products
INR 91 Cr (Micro Cap)
9.00
37
0.00%
0.55
11.10%
1.16
Total Returns (Price + Dividend) 
Sellowrap Indus. for the last several years.
Risk Adjusted Returns v/s
Returns Beta

News
Sellowrap Industries Ltd is Rated Sell
Sellowrap Industries Ltd is rated 'Sell' by MarketsMOJO, with this rating last updated on 26 May 2026. However, the analysis and financial metrics presented here reflect the stock's current position as of 27 May 2026, providing investors with the latest insights into the company’s performance and outlook.
Read full news articleAre Sellowrap Industries Ltd latest results good or bad?
Sellowrap Industries Ltd reported its Q4 FY26 results, showcasing a notable surge in net sales, which reached ₹67.81 crores, reflecting a 46.39% increase from the previous quarter and a 73.16% increase year-on-year. This performance indicates strong demand dynamics in the company's markets. However, this revenue growth was accompanied by significant challenges in profitability metrics. The consolidated net profit for the quarter was ₹1.77 crores, representing a decline of 30.86% compared to the previous quarter, although it showed a 9.94% increase year-on-year. Operating margins, excluding other income, contracted sharply to 9.10% from 14.23% in the prior quarter, highlighting a concerning trend in profitability despite the strong sales growth. The profit after tax (PAT) margin also fell to 2.34%, down from 5.59% in Q3 FY26, further indicating pressure on earnings quality. Additionally, the company faced...
Read full news article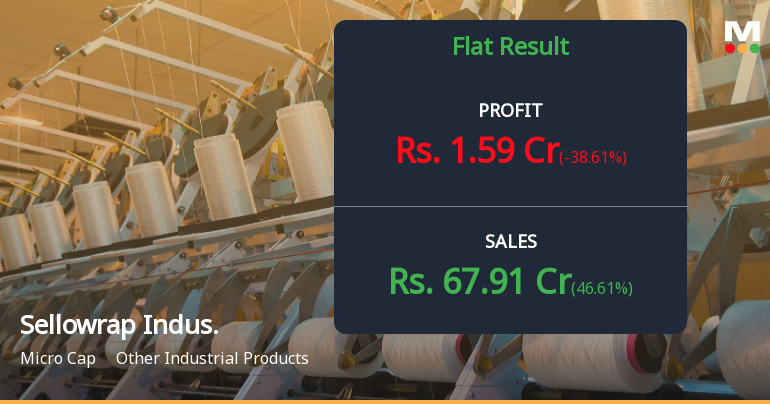
Sellowrap Industries Q4 FY26: Strong Revenue Growth Masks Margin Pressure and Profit Decline
Sellowrap Industries Ltd., a micro-cap player in the Other Industrial Products sector with a market capitalisation of ₹95.00 crores, reported a mixed performance in Q4 FY26 (January-March 2026), with robust revenue expansion offset by a sharp contraction in profitability. The company posted consolidated net profit of ₹1.77 crores for the quarter, representing a decline of 30.86% sequentially (QoQ) from ₹2.56 crores in Q3 FY26, though up 9.94% year-on-year (YoY) from ₹1.61 crores in Q4 FY25. The stock has experienced significant volatility, trading at ₹72.00 as of May 26, 2026, down 2.37% on the day and 9.43% over the past week, reflecting investor concerns about margin compression despite strong topline growth.
Read full news article Announcements
Corporate Actions

No Upcoming Board Meetings

No Dividend history available

No Splits history available

No Bonus history available

No Rights history available
Quality key factors
Valuation key factors
Technicals key factors
 Technical Indicator Scale: Bearish, Mildly Bearish, Sideways, Mildly Bullish, Bullish Turned
 Shareholding Snapshot : Mar 2026
Shareholding Compare (%holding)
Promoters
None
Held by 0 Schemes
Held by 1 FIIs (3.67%)
Sushil Kumar Poddar (26.59%)
Meru Investment Fund Pcc-cell 1 (3.67%)
19.04%
Quarterly Results Snapshot (Standalone) - Mar'26 - QoQ

QoQ Growth in quarter ended Mar 2026 is 46.61% vs 6.02% in Dec 2025

QoQ Growth in quarter ended Mar 2026 is -38.61% vs 6.15% in Dec 2025
Half Yearly Results Snapshot (Consolidated) - Sep'25
Growth in half year ended Sep 2025 is -0.65% vs 15.74% in Mar 2025
Growth in half year ended Sep 2025 is 33.26% vs -16.95% in Mar 2025
Nine Monthly Results Snapshot (Standalone) - Dec'25
Not Applicable: The company has declared_date for only one period
Not Applicable: The company has declared_date for only one period
Annual Results Snapshot (Consolidated) - Mar'26
YoY Growth in year ended Mar 2026 is 23.62% vs 17.70% in Mar 2025
YoY Growth in year ended Mar 2026 is 5.41% vs 61.51% in Mar 2025
About Sellowrap Industries Ltd

Company Coordinates


