
Compare Semac Construct with Similar Stocks
Dashboard
Weak Long Term Fundamental Strength with an average Return on Equity (ROE) of 8.54%
- Poor long term growth as Net Sales has grown by an annual rate of 12.91% and Operating profit at 13.25% over the last 5 years
- Company's ability to service its debt is weak with a poor EBIT to Interest (avg) ratio of -1.62
With a growth in Net Profit of 189.17%, the company declared Outstanding results in Mar 26
With ROE of 8.8, it has a Very Attractive valuation with a 1.3 Price to Book Value
Majority shareholders : Promoters
Consistent Underperformance against the benchmark over the last 3 years
Total Returns (Price + Dividend) 
Latest dividend: 5 per share ex-dividend date: Oct-19-2023
Risk Adjusted Returns v/s
Returns Beta

News
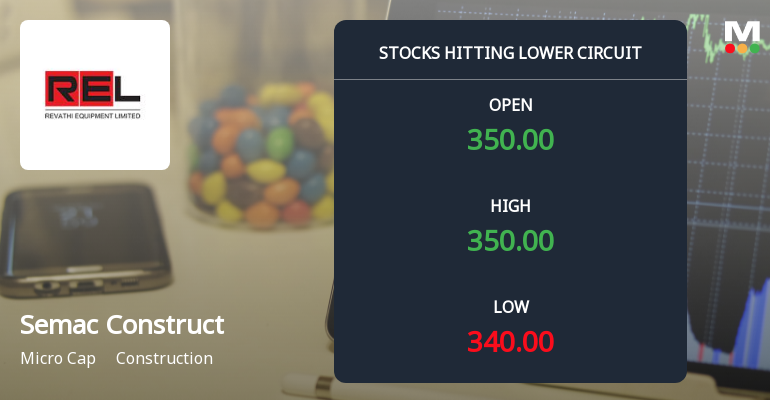
Semac Construction Ltd Locks at Lower Circuit With 4.92% Loss — Sellers Queue, No Buyers in Sight
At Rs 330.60, Semac Construction Ltd locked at its lower circuit on 7 Jul 2026, falling 4.92% within a 5% price band. Sellers were lined up to exit, but no buyers emerged to absorb the supply, resulting in a frozen price and unfilled sell orders that highlight the liquidity challenges facing this micro-cap stock.
Read full news article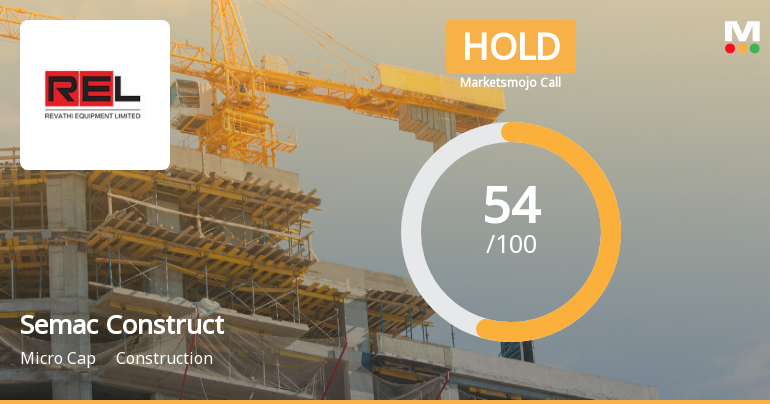
Semac Construction Ltd Upgraded to Hold as Technicals Improve Amid Mixed Financial Signals
Semac Construction Ltd has seen its investment rating upgraded from Sell to Hold, reflecting a notable shift in its technical outlook and financial performance. The upgrade, effective from 6 July 2026, is driven by improvements across four key parameters: quality, valuation, financial trend, and technical indicators. This article analyses the factors behind the rating change and what it means for investors navigating the micro-cap construction sector.
Read full news article
Semac Construction Ltd is Rated Sell
Semac Construction Ltd is rated Sell by MarketsMOJO, with this rating last updated on 24 June 2026. However, the analysis and financial metrics discussed below reflect the company’s current position as of 06 July 2026, providing investors with the latest insights into the stock’s fundamentals, valuation, financial trends, and technical outlook.
Read full news article Announcements
Closure of Trading Window
24-Jun-2026 | Source : BSEClosure of trading window for the quarter ended 30th June 2026.
Announcement under Regulation 30 (LODR)-Newspaper Publication
30-May-2026 | Source : BSENewspaper publication of Financial result for the period ended 31st March 2026.
Compliances-Reg.24(A)-Annual Secretarial Compliance
29-May-2026 | Source : BSEAnnual Compliance Report for the period ended 31st March 2026.
Corporate Actions

No Upcoming Board Meetings

Semac Construction Ltd has declared 50% dividend, ex-date: 19 Oct 23

No Splits history available

No Bonus history available

No Rights history available
Quality key factors
Valuation key factors
Technicals key factors
 Technical Indicator Scale: Bearish, Mildly Bearish, Sideways, Mildly Bullish, Bullish Turned
 Shareholding Snapshot : Mar 2026
Shareholding Compare (%holding)
Promoters
None
Held by 0 Schemes
Held by 1 FIIs (0.04%)
Ajai Hari Dalmia Trust (45.68%)
Rhea Dipak Shah (1.23%)
28.21%
Quarterly Results Snapshot (Consolidated) - Mar'26 - QoQ

QoQ Growth in quarter ended Mar 2026 is 26.98% vs 2.90% in Dec 2025

QoQ Growth in quarter ended Mar 2026 is 237.86% vs 14,100.00% in Dec 2025
Half Yearly Results Snapshot (Consolidated) - Sep'25
Growth in half year ended Sep 2025 is 103.51% vs -28.65% in Sep 2024
Growth in half year ended Sep 2025 is 118.71% vs -205.49% in Sep 2024
Nine Monthly Results Snapshot (Consolidated) - Dec'25
YoY Growth in nine months ended Dec 2025 is 68.60% vs -2.87% in Dec 2024
YoY Growth in nine months ended Dec 2025 is 135.36% vs 57.69% in Dec 2024
Annual Results Snapshot (Consolidated) - Mar'26
YoY Growth in year ended Mar 2026 is 40.42% vs 35.57% in Mar 2025
YoY Growth in year ended Mar 2026 is 220.71% vs 81.63% in Mar 2025
About Semac Construction Ltd

Company Coordinates


